Results
After clicking Run, the Result Viewer opens directly. No partial differential equation is solved, and thus no computational resources are needed for the Forchheimer Approximation.
Report
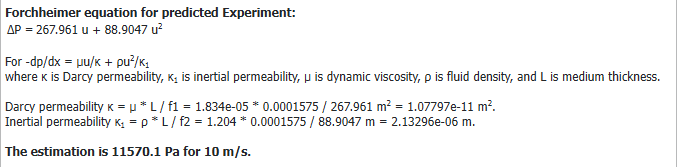
The Results - Report tab shows the approximation of Forchheimer’s equation that fits the entered velocity / pressure drop pairs. The report also shows the determined parameters for the Darcy permeability and the Inertial permeability as defined in (375) Forchheimer’s equation.

Below, the approximation of Forchheimer's equation for the predicted experiment is shown. While the Darcy permeability and the Inertial permeability will always be identical to the measured experiment (we assume it is the same porous material), the formula given for will differ if a different media thickness or different fluid parameters were used for the prediction:
Plots
The Results - Plots subtab shows the computed quadratic polynomial in a graph. The velocity / pressure drop pairs entered in the Forchheimer Approximation Options dialog are highlighted on the curve with a blue X, while the green X shows the predicted velocity / pressure drop pair. The plot can be further customized by right-clicking into the plot area. See the Result Viewer user guide for details.

Post-Processing
In the post-processing area on the left, you can change all parameters entered in the Predicted Experiment panel. Click Apply to change the plot and report of the result file. If you choose the media thickness or fluid density and viscosity different from the Measured Experiment, the Predicted Experiment curve will differ from the Measured Experiment curve.
|
Important! Note that after clicking Apply, the result file changes and is not the original simulation result file anymore! If Back-up result file is checked, the original *.gdr file is saved in the result folder and can be restored at any time. |

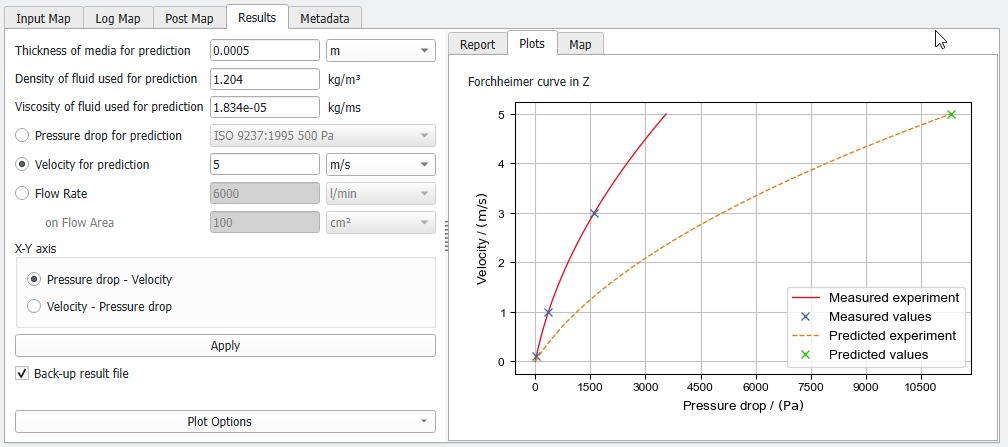
The graph can also be plotted with interchanged axes by checking Velocity – Pressure drop and clicking Apply.