Electrochemical Impedance Spectroscopy
Calculate the complex-valued resistance called "impedance" that many battery developers and scientists use to understand the behavior of electrical components like resistors, capacitors, inductors and batteries.
Technically, this GeoApp sets expert settings for Electrochemical Impedance Spectroscopy (EIS) simulation and runs a charging simulation using the current settings in Charge Battery, Charge Electrode, Charge Homogenized Battery, or Charge Homogenized Electrode in BatteryDict.
Needed Modules: BatteryDict, BatteryDict-BEST, BatteryDict-EIS |
Theoretical Background
Performing an EIS simulation is currently only possible with the BEST solvers. The simulation by itself does not modify the underlying model equations, it only activates an additional double layer model for the interface active material - electrolyte.
The electrochemical double layer describes an effect at the interface of liquid electrolytes and active materials. Due to the polarization of the electrodes, the ions in the electrolyte arrange in a layered structure close to the active material surface, which imposes charge separation and acts as a capacitor. This takes place on the molecular scale. The double layer stores charges based on the voltage at the interface, releasing charges as the voltage drops or accumulating them as voltage increases, similar to a capacitor. Since the capacity of the double layer is comparatively small relative to the overall cell capacity, it equilibrates fast with voltage changes and has minimal impact during regular cell operation in the field. Only when studying higher frequency dynamics, the double layer becomes crucial to consider. An example for this is the characteristic semi-circle in EIS, which is the result of the intercalation and double layer acting similar to a resistor-capacitor pair.
The double layer model is based on Hein, 2020 and introduces an additional interface current density between active material and electrolyte that is connected in parallel with the intercalation model resulting in a total interface current of
where is the Butler-Volmer interface current and is the double layer current.
For a comparison the usual equations for the interface between electrolyte and active material are given in the Fully Resolved Simulation and Homogenized Simulation topics of the BatteryDict User Guide.
The double layer is modeled as an effective interface property between active material and electrolyte acting as ideal capacitor. The current density flowing across the double layer is given by
using the areal capacitance , the local Maxwell potential of the electrode , and the local electrochemical potential in the electrolyte .
The figure below shows the different configurations that can be achieved with the intercalation and double layer model. It visualizes the different settings that are considered with the double layer model. The circuit drawings provide some information on how these settings would translate if the interface conditions of the continuum scale modeling approach would be transferred to an equivalent circuit model. On the left, the active material-electrolyte interface as modeled in Charge Battery and Charge Electrode is shown. Only the Butler-Volmer exchange current density is considered, resulting in an interface resistance. On the right, the model used in EIS-simulations is shown. Double layer and intercalation kinetics are both active and connected in parallel acting as a resistor-capacitor pair.
Finally, a specific predefined voltage operation protocol with Amplitude 10mV is executed including the double layer model to get the time transient current response of the cell. Afterward, the time, current and voltage information can be post-processed to translate the information to the frequency domain and evaluate the complex impedance.
Parameters
Clicking Edit... opens the Electrochemical Impedance Spectroscopy dialog. At the top, define a Result File Name for the result file and the result folder containing the BatteryDict charging simulation run with the EIS plots.
To automatically add the suffix "_EIS" to this result file name, check Add Suffix _EIS to BatteryDict Result File.
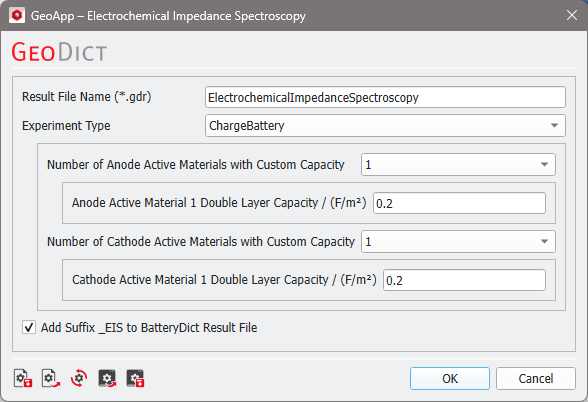
Choose the experiment type (Charge Battery, Charge Electrode, Charge Homogenized Battery or Charge Homogenized Electrode) and optionally the custom double layer capacities of the active materials.
Subsequently, when choosing Charge Battery or Charge Electrode for the simulation, you can use either BESTmeso (homogenized simulation) or BESTmicro (fully resolved simulation) as a solver. Charge Homogenized Battery or Charge Homogenized Electrode are always run with the BESTmeso solver.
The start condition of the Experiment tab of the selected experiment type will be used. However, instead of a (dis)charging / (de)lithation experiment, the EIS experiment at this start condition is simulated.
Results
After the BatteryDict simulation is finished the result file is opened in the Result Viewer.
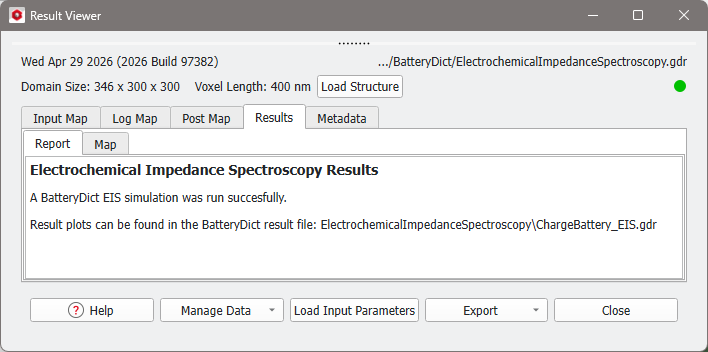
The report tells you where to look for the results. Load the BatteryDict result file from the result folder (File → Open Results (*.gdr)) Additionally to the usual BatteryDict results, the report shows the Electrochemical impedance spectrum table. In the example, we used Charge Battery with the BESTmeso solver.
Under the Plots tab you find three EIS plots selectable from the pull-down menu: One Nyquist plot and two Bode plots.
The Bode plots visualize the real and imaginary part of the frequency response as well as the phase angle. All plots are shown for the full cell as well as for cathode and anode separately.
