Battery Capacity Test
Fast charging of batteries reduces the accessible cell capacity. The GeoApp Battery Capacity Test allows prediction and easy comparison of accessible cell capacity for different charge rates. A voltage window can be defined in the same way as it is defined in experiments for a battery or electrode.
A charging profile, consisting of 4 steps is computed for each charge rate:
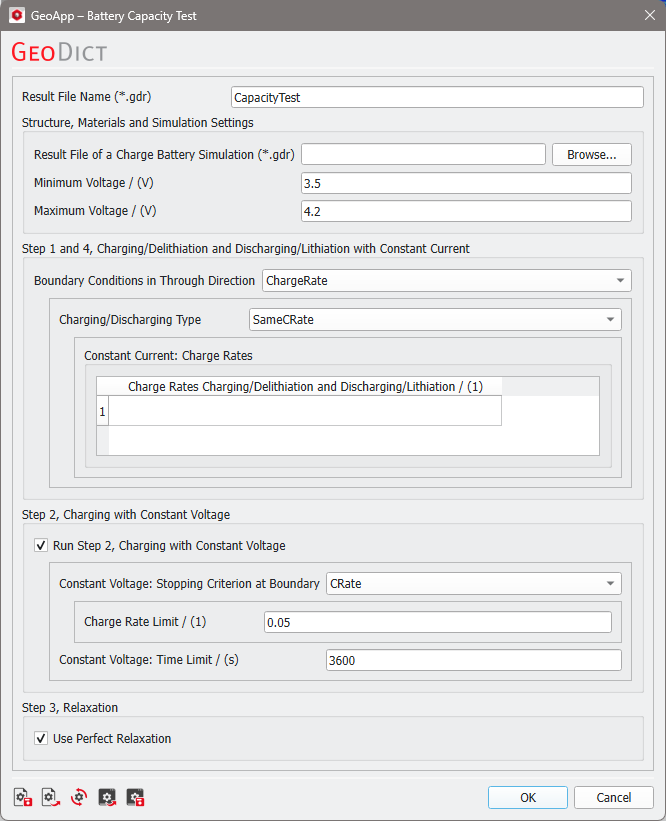
- Charging (delithiation) with constant charge rate until a defined maximum voltage
- Charging (delithiation) with constant voltage until a limiting C-rate or maximum time
- Relaxation to equilibrium
- Discharging (lithiation) with constant charge rate until a defined minimum voltage
Needed Modules: BatteryDict |
|
Note! Also have a look at our website for more information. |

Parameters
Clicking Edit... opens the Battery Capacity Test dialog. At the top, define a Result File Name for the result file and the result folder containing the generated structure and volume fields.
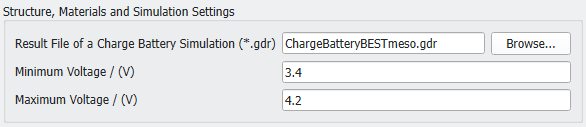
 Structure, Materials and Simulation Settings
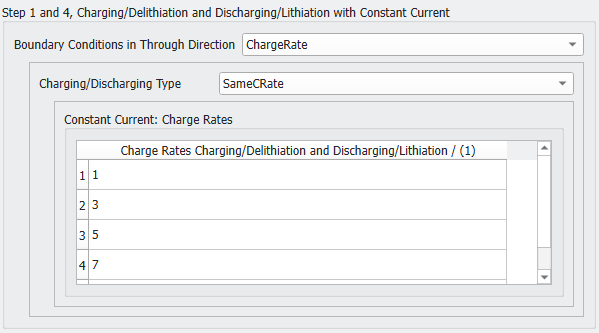
Step 1 and 4, Charging / Delithiation and Discharging / Lithiation with Constant Current
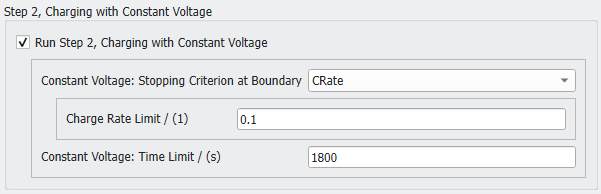
Step 2, Charging with Constant Voltage


Results
After successfully running the command, the result file created is opened in the GeoDict Result Viewer.
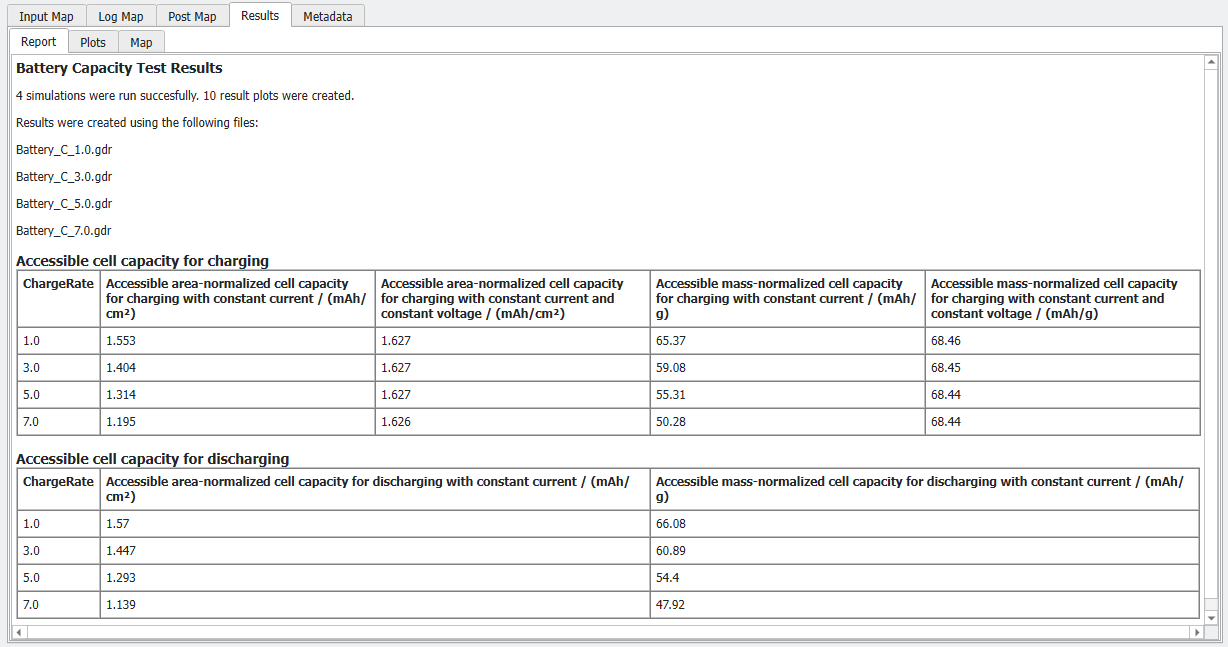
Under the Results-Report subtab, the file names of all simulations run, and saved in the project folder, are listed. The accessible area-normalized and mass-normalized cell capacities are shown in separate tables for the charging/delithiation and discharging/lithiation.
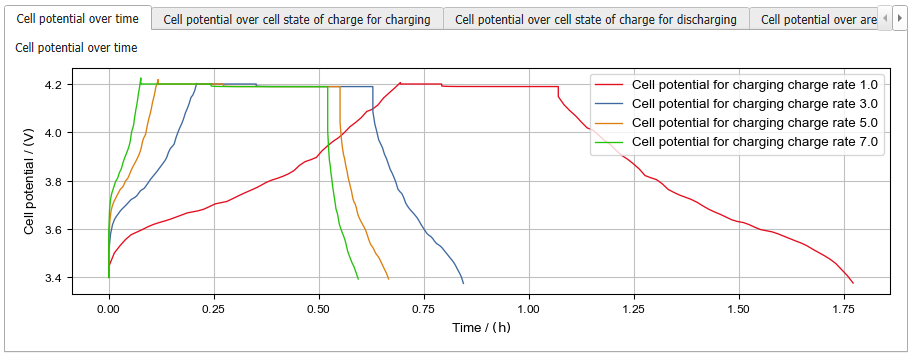
Under the Results - Plots subtab, the results of the simulations are compared in different ways. The whole charge curve for all simulations is shown as Cell potential over time.
Under the following tabs, the cell potential of all simulations is shown for charging / delithiation and discharging / lithiation separately. First as cell potential over the cell state of charge, and then over the area-normalized and mass-normalized cell capacity density.
The two tabs Accessible area-normalized cell capacity and Accessible mass-normalized cell capacity over charge rate for charging and discharging, compare the accessible capacities for the different simulations. These values are also listed in the Report.
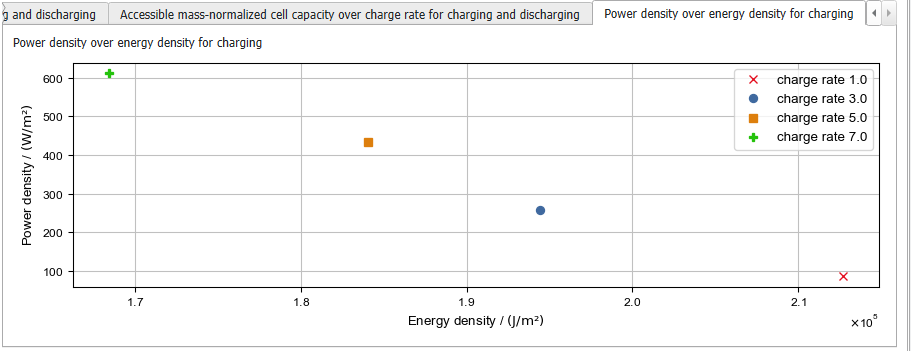
Finally, the plot under the last tab shows the Power density over the energy density computed for the charging step 1, charging with constant charge rate.
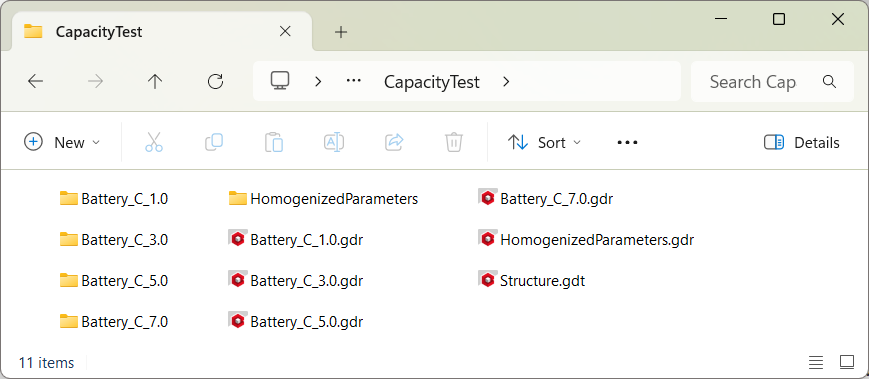
In the Result Folder find the intermediate results from the charging simulations for the different charging steps: