Trapping Curve
The Trapping Curve GeoApp predicts a capillary pressure hysteresis cycle and creates a trapping curve for the currently loaded structure and given contact angle. Initially, the pore space is filled with water. Then, a primary drainage with a selected invading fluid is computed. For a chosen number of saturation steps a secondary imbibition with water is computed.

|
Modules needed to run this GeoApp:
SatuDict
|
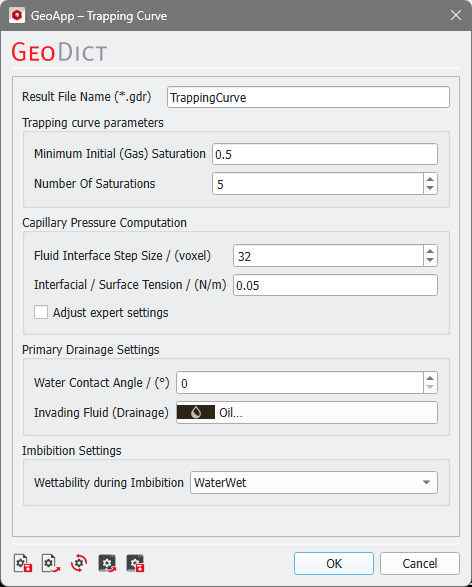
Click Edit to open the Trapping Curve Parameters dialog.
The parameters are organized in four groups:
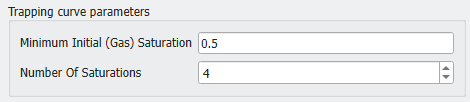
 Trapping curve parameters
Set the Minimum Initial (Gas) Saturation to determine the trapping curve from fully gas-saturated pore volume down to the given value between 0 and 1.
Define the Number Of Saturations, i.e., the number of imbibitions calculated for the trapping curve.
The starting saturations of the invading fluid for the imbibition are distributed between the value entered in Minimum Initial Saturation and 1.
|
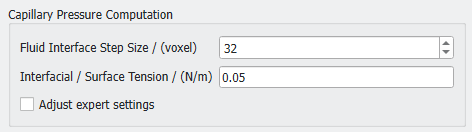
Capillary Pressure Computation
Define the Fluid Interface Step Size for the corresponding capillary pressure method. The Fluid Interface Step Size determines the range of voxels that can be maximally saturated within one pressure step. Lower values might increase the runtime and the number of saturation steps significantly, but give a more realistic development of the saturation process.
Set the Interfacial / Surface Tension between the invading and the displaced fluid.
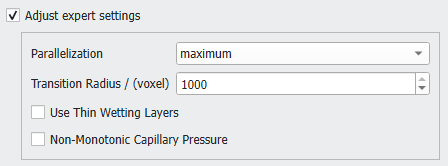
The available expert settings include Parallelization, Transition Radius, and whether Thin Wetting Layers and/or Non-Monotonic Capillary Pressure should be applied. Refer to the Capillary Pressure Curve chapter for a detailed explanation of these saturation experiment parameters.
|
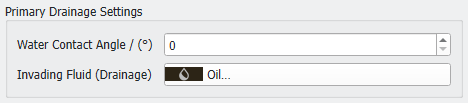
Primary Drainage Settings
By default, the initial pore fluid is water. Enter the Water Contact Angle that is used for the primary drainage computation. Select the Invading Fluid for the primary drainage from the Material Database.
|
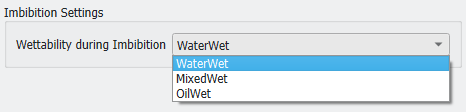
Imbibition Settings
Set the Wettability during Imbibition as explained for the Hysteresis for Oil-Water Setups GeoApp. Note, that here oil-wet means that the solid surfaces covered with the invading fluid (not necessarily oil) change their wettability.
|
Click Run to create the trapping curve.
Results
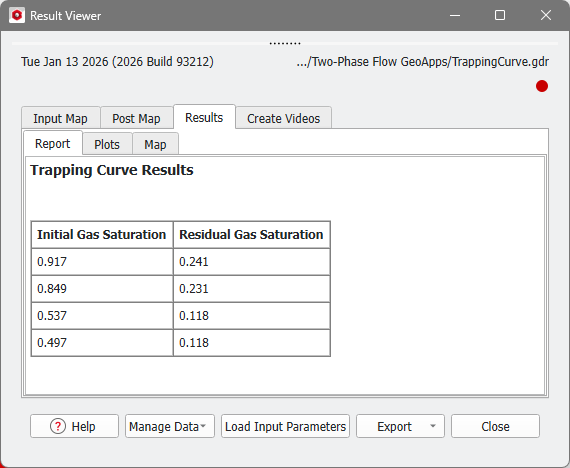
When the simulation is finished, the result file opens in the Result Viewer automatically.
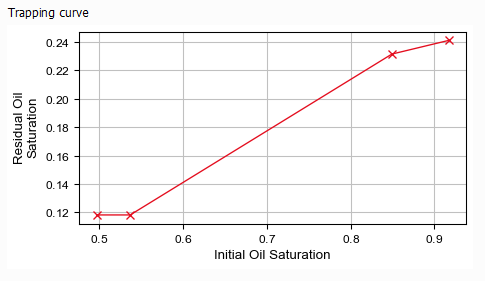
The Results - Report subtab of the Result Viewer shows a table with the saturation of the invading fluid at the beginning of the imbibition (Initial Gas Saturation) and after the imbibition (Residual Gas Saturation).
These values are also plotted in a Trapping curve available in the Plots subtab.