2D Slice Visualization
In the default Tile View, the 2D Slice Visualization section contains the preview areas for the X-Y, Y-Z, X-Z planes.
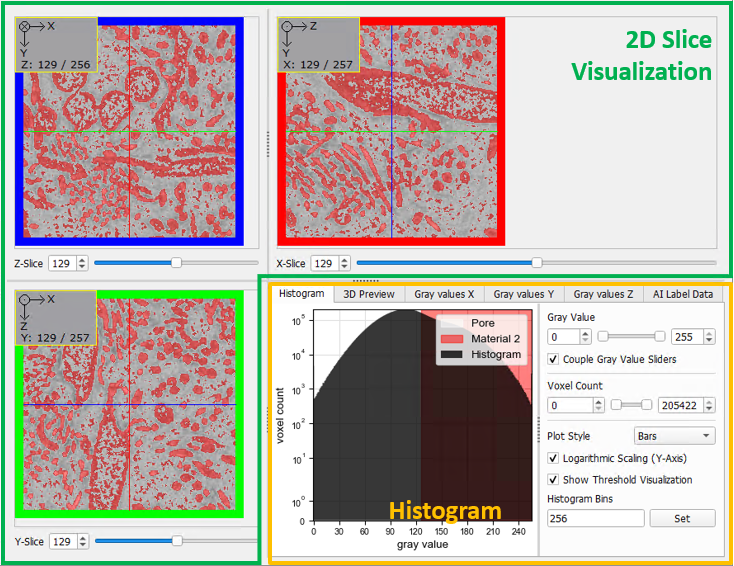
The values for Z-Slice, X-Slice, and Y-Slice, located below the 2D images, control which slices are shown in the preview areas above. You can quickly change these values by resting the mouse cursor on the field box or the corresponding image slice and using the mouse wheel. The slice being shown also moves in the three-dimensional representation in the 3D Preview tab in the histogram section.
You can zoom in and out using the corresponding buttons in the View Options section, or by clicking and holding CTRL while scrolling the mouse wheel over a gray value image slice. To zoom continuously, right-click on the 2D image, hold the right mouse button, and move the mouse up and down.
Pan the image by holding down the left mouse button while moving the mouse.
For more information on 2D visualization, please refer to the View menu and the View Options section. Since the grayscale image is loaded into the GeoDict visualization area as well, consider the advanced 3D visualization options described in the Visualization user guide.
