Menu Bar
From the Menu Bar in the 3D Image Processing dialog, you can access File options that allow you to save the image as a 2D image slice(s) or as 3D image data. You can also back-up the current processing status of the gray value image. The View menu tree contains many of the available view settings. The other two tabs lead to all Image Processing and Segmentation & Labeling tools.
File
From the File menu, you can save the image as a 2D Image Stack or a 3D Image. This allows you to save the processed images as grayscale data before (or instead of) importing them into GeoDict.
 Save as 2D Image Stack
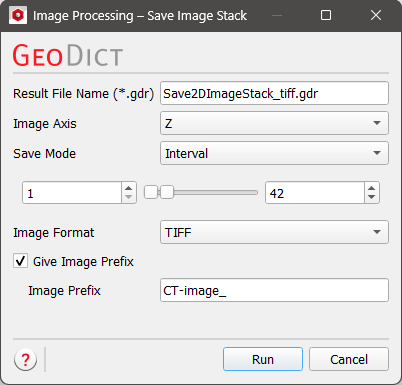
At the top of the dialog, provide a name for the Result File and the result folder. The 3D image dataset can be saved as a stack of 2D images in one of the spatial directions (X, Y, or Z). The names of the saved 2D images contains the selected direction and the slice number and start with either the folder name or a prefix if you choose Give Image Prefix.
You can select to save the entire stack of 2D images (All), a range of them (Interval), or just one (Single Image). If you select Interval, (1 to 42 in the shown example), the images in the Z-direction are saved as 2D TIFF files to the chosen folder. The images are named from CT-image_Z00001.tif through CT-image_Z00042.tif.
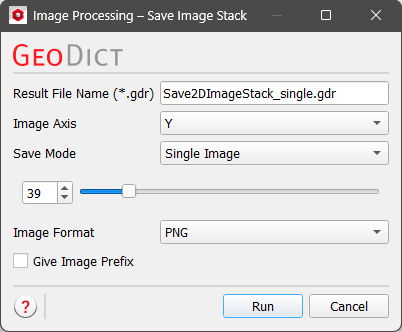
Also, a Single Image may be saved as a 2D image. For example, here, slice 39 in the Y-direction would be saved as PNG image.
Depending on the data, slices may be saved as 2D images in either the 8-bit PNG or as 8-/16-bit TIFF file format.

|
Note! Upon import, 32-bit image data is converted to 16-bit, so it will also be exported as 16-bit TIFF files.
|
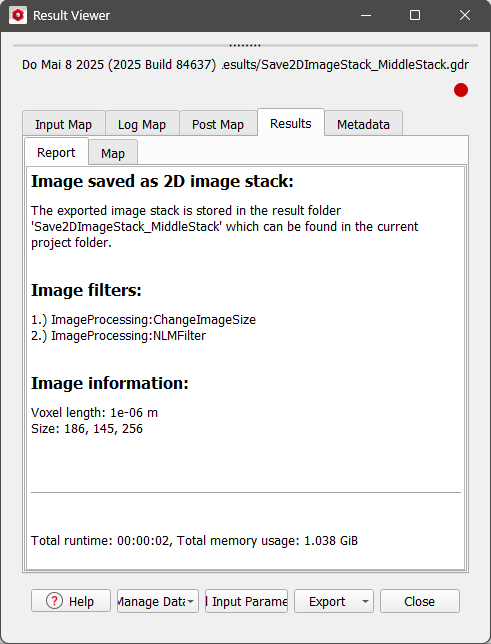
The slice thickness is one voxel length. Additionally, a GeoDict result file (*.gdr) with the given name is saved to the current project folder. This file contains information about the applied filters and the original image dimensions. Open the result file in the Result Viewer by selecting File → Open Results (*.gdr) from the menu bar in the GeoDict main window.
|
Save as 3D Image
You can save 3D images in a single 3D data file with one of these file formats:
- GeoDict Raw File (*.grw)
- 8 or 16 Bit 3d Grayvalue Image (*.tif)
- 8 or 16 Bit Integer Raw Data (*.raw)
- 32 Bit Integer Raw Data (*.raw)
- DICOM File, Multi-Frame (*.dcm)
- DICOM File, Zipped (*.dmz)
Define a Result File Name at the top of the dialog. Click Run to store the result file and 3D image file in the current project folder.
More options are available when storing data in the GeoDict *.grw file format. A *.grw file is a GeoDict Universal File with a standardized header describing the 3D data format. You can read this header with a text editor such as Notepad++.
Checking the Compress box will compress the raw part of the image. Thus, the image data is compressed while the header remains uncompressed.
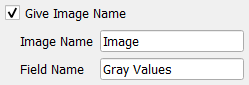
Define the Image Name and the Field Name by checking Give Image Name. These names are visible when loading the gray values into GeoDict as a volume field, for example. The name will then appear in the Project Status section and as a the title of the gray value legend. If Give Image Name is not selected, the default names Image and Gray Values are used instead.
Additionally, a GeoDict result file (*.gdr) with the defined Result File Name is saved to the current project folder. This file contains information about the applied filters and the image dimensions. Open the result file in the Result Viewer by selecting File → Open Results (*.gdr) from the menu bar in the GeoDict main window.
|
View
The View menu contains all the options available for displaying the gray value image as 2D slices in the 2D Slice Visualization section.
View Mode
The View Mode allows you to switch between Tile View and Stacked View.
The Tile View displays the three 2D slices (for the X-Y, X-Z, and Y-Z planes) and the histogram section, as shown in the screenshot of the 3D Image Processing dialog here.
In Stacked View, only one 2D slice or tab from the Histogram section is displayed. You can focus on a specific visualization by selecting it from the available tabs.
|
Axes
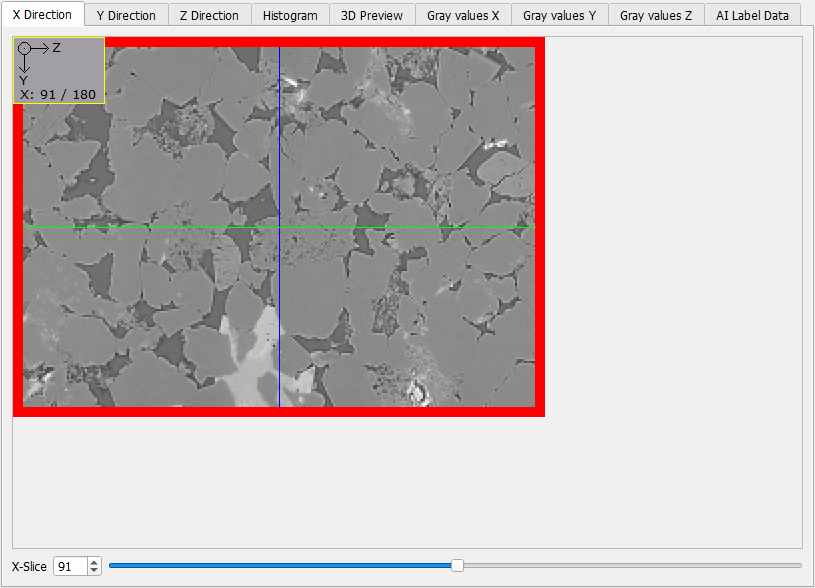
The Axes selection controls the display of lines that provide orientation in the 2D image slices. For Synced, the lines show the currently selected slices in the other two planes, as seen in the screenshot below. The colors of the lines correspond to the colors of the boundaries around the slices in the 2D Slice Visualization section (blue for the X-Y plane, green for the X-Z plane, and red for the Y-Z plane). For Centered RGB, the lines are always displayed in the center. For None, the lines are invisible.
|
Main Plane
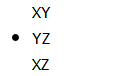
From the View menu, you can select the Main Plane. This option only affects the visualization in Tile View. The selected plane is displayed in the upper left panel (here, YZ), and the order of the panels changes according to the selection.
|
Show Coordinates
Check or uncheck Show Coordinates to control whether the legend in the upper left corner is displayed. The legend contains information about the plane and slice in the preview areas for the three directions.
|
Outline Segmentation
Outline Segmentation refers to the representation of the thresholding settings, which is explained in more detail in the Image Segmentation section.
|
Use GeoDict Custom Colors
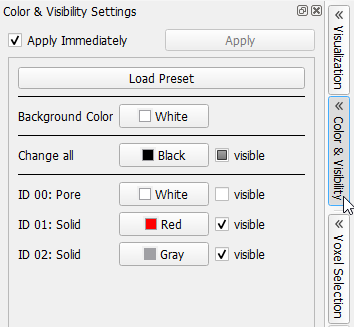
Use GeoDict Custom Colors to change the colors representing the threshold settings for the image segmentation to those currently defined in the main GeoDict GUI. These color settings are accessible via the Color & Visibility tab in the sidebar to the right of the main GeoDict window:
|
Auto Collapse Tree
When the Auto Collapse Tree option is selected, only the currently chosen feature from the Image Processing or Segmentation & Labeling tab is visible in the Image Processing and Segmentation section. For convenience and simplification, all other features are automatically collapsed after selecting another feature in the respective tab.
|
Sync Scrollbars
Select the Sync Scrollbars option to synchronize the 2D slices in the Tile View when scrolling the excerpt up, down, left, or right.
|
Image Processing
The Image Processing menu provides an overview of the 3D Image Processing tools in GeoDict.
Click on the names of the various features to be forwarded directly to the corresponding functionality in the Image Processing tab to the left of the 3D Image Processing dialog.
Segmentation & Labeling
The Segmentation & Labeling menu provides an overview of the 3D Image Segmentation and Labeling tools in GeoDict.
Click on a features's name to be forwarded directly to its corresponding method in the Segmentation & Labeling tab to the left of the 3D Image Processing dialog.