Histogram
The Histogram section contains statistical information about the gray value image and is organized into several tabs.

Histogram
The Histogram shows the frequency of all gray values as absolute numbers, providing information on the number of distinguishable material phases. The appearance of the histogram, on the bottom right, is controlled by the options right next to it and by the context menu, which is accessed by right-clicking in the plot. The histogram plots the number of voxels against the gray values (within a given range) and shows how many voxels have a particular gray value.
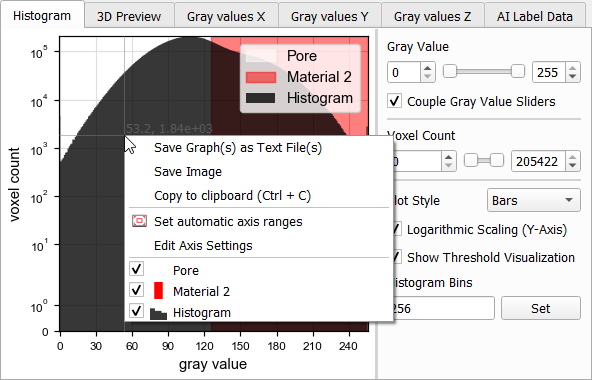
The Gray Value and Voxel Count ranges control the horizontal and vertical axes of the histogram, respectively. To focus on a specific area of the plot, adjust the voxel count and gray value ranges. The histogram will then change to show the portion of the plot corresponding to the new range of values.
The Couple Gray Value Sliders option couples the changes made to the Gray Value slider in the histogram with the general Gray Value Range in the image preview. This allows you to apply changes made in the histogram to the 2D Slice Visualization as well.
Depending on the preferred visualization, the Plot Style can be changed from the default Bars to a Line plot.
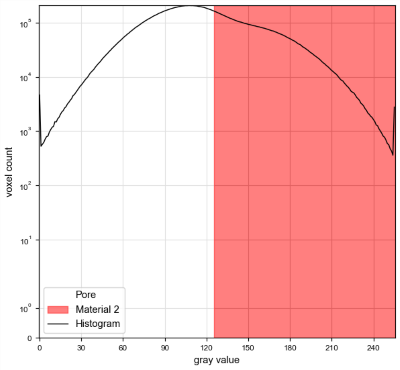
Deactivate Logarithmic Scaling of the Y-Axis to highlight the gray value ranges of material phases.
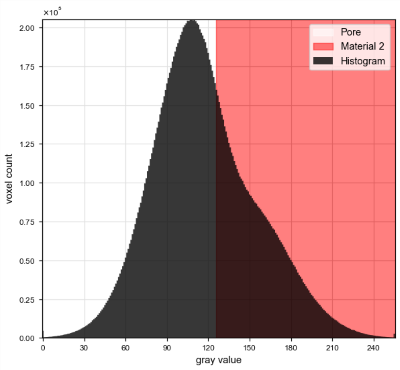
To disable the depiction of the segmentation thresholds between the different defined materials, choose not to Show Threshold Visualization. Find more information on segmentation thresholds here.
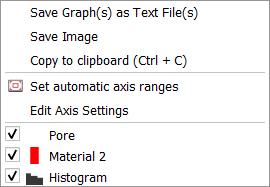
Right-click on the plot area to change its appearance further, save the image as a *.png or *.svg file, copy the image to the clipboard, or store all graph values in a *.txt file. The context menu is the same as that for Result Viewer plots and is described in more detail in the Result Viewer User Guide.
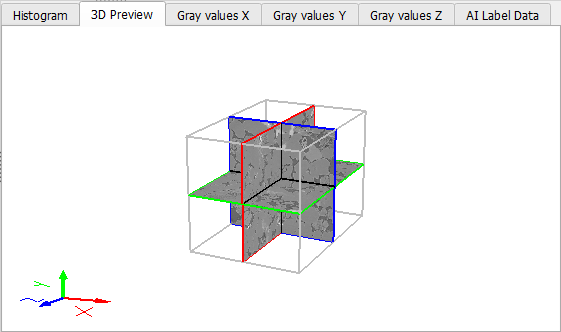
3D Preview
The 3D Preview shows the X-, Y-, and Z-slices currently selected in the 2D Slice Visualization as a 3D representation. This representation updates interactively when the slice selection is changed. Full 3D visualization options are available in the main GeoDict GUI. Please refer to the Visualization User Guide for more information.
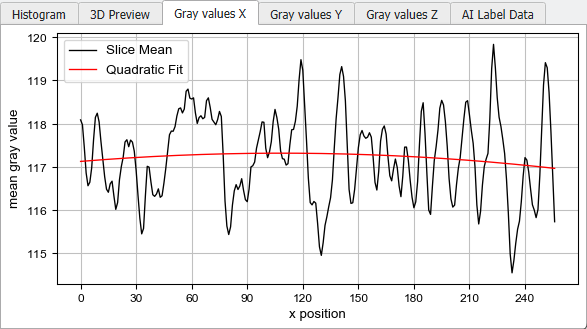
Gray Values X, Y, Z
The slice mean of the gray values is plotted in the X, Y, and Z tabs of the Gray Values plots. Additionally, a quadratic fit is calculated and plotted. These graphs may reveal brightness gradients in the scans. The Gradient Brightness Correction and Gaussian Brightness Correction filters can correct such brightness gradients.
AI Label Data
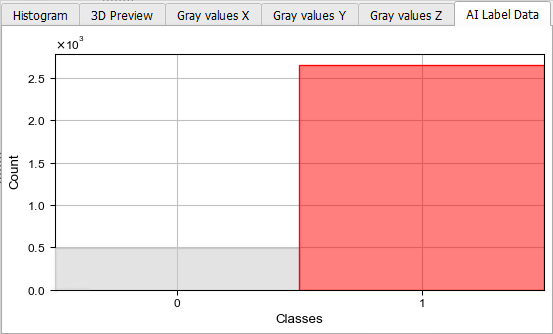
In the AI Label Data tab, you find a plot showing the number of voxels per labeled material for the AI Segmentation. This tab is only available if the image was labeled as described here.
The plot shows the amount of training data for each labeled material Class. This helps evaluate whether the Count of labeled voxels is similar enough for all materials and allows you to improve the labeling. In the example below, there are many more red (solid material) voxels than white (pore space) voxels.