Options
The 2-Point Correlation dialog opens when clicking the Edit… button and includes the Correlation Options tab and the References tab, which provides further information about the underlying algorithm and cites S. Blair and S. Torquato.
At the top of the 2-Point Correlation dialog, enter the Result File Name. The result file is saved in the chosen project folder (File → Choose Project Folder in the menu bar).
 Geometry Mode
From the Geometry Mode pull-down menu decide if you want to compute the two point correlation on the currently loaded structure (Current Geometry) or on the Current Index Image (for example from a GrainFind - Identify Grains run). In the second case, the name of the currently loaded index image is displayed below.
If you compute on an index image, it gives the probability that two points at a certain distance belong to the same object or cluster, i.e., they share the same index.
|
Compute Correlation for
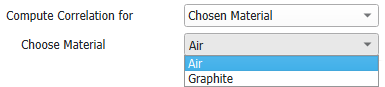
If you choose the Geometry Mode Current Geometry, you have to select for which material phases you want to Compute Correlation for.
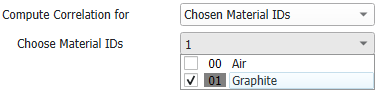
Either Pore, Chosen Material, or Chosen Material IDs can be selected.
The current structure is then converted into a binary image where the value of a voxel is set to 1, if the voxel belongs to the chosen material phase, and 0 if not. This binary image is used to calculate the correlation function.
If you select Chosen Material, choose one of the materials present in the structure from the pull-down menu below.
With the mode Chosen Material IDs, you can select multiple Material IDs, also of different assigned materials.
|
Number of Samples and Random Seed
To find the probability distribution for different distances, several samples of point pairs for each distance are generated. The Number of Samples determines how many point pairs are generated. For different Random Seeds different randomly chosen points are compared if they belong to the same type. The resulting probability is more accurate the more samples are taken.
|
Maximal Length Scale
The Maximal Length Scale / (Voxel) defines the largest distance for which correlations are computed.
Only distances smaller or equal than the domain size in the computational direction are allowed. If Isotropic is chosen as direction, the distance is not allowed to be larger than the smallest domain length.
However, in case Periodic is checked, the entered length is allowed to be larger than the domain size. In this case the correlation repeats periodically.
|
Direction
The correlation can be calculated either in X Direction, Y Direction, or Z Direction or as an average over all three directions by choosing Isotropic.
|
Normalization
Two different methods to normalize the computed correlation function are available: Correlation Coefficient and Probability (new in GeoDict 2026).
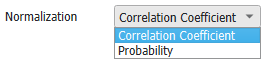
- For Correlation Coefficient, the correlation value varies between -1 and 1, where 1 means perfect correlation, 0 means no correlation, and the value -1 means perfect anti-correlation. The correlation function is scaled by the variance of the selected phase, such that for distance 0, the correlation is always 1, since a voxel has always the same property as itself.
- When choosing Probability, the correlation function has values between 0 and 1, as it measures the probability that two points at a certain distance belong to the same phase. At distance 0 the correlation equals the phase volume fraction of the material phase selected under Compute Correlation for. If for example Pore is selected, the correlation at distance 0 equals the solid volume fraction of the structure. For very large distances, the correlation tends to the square of the phase volume fraction. Both the phase volume fraction and its square are shown in the resulting correlation plot.
|
Periodic
If Periodic is checked, the structure is assumed to be periodic in the chosen computational directions. Thus, point samples can also be connected across domain boundaries.
|