Data Visualization
Under the Data Visualization tab, it is possible to visualize the computed densities, porosities, or solid volume fractions of the sub-volumes.
Clicking on Load Solution File loads the result field.
|
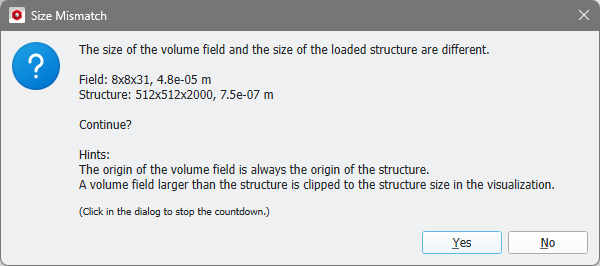
Note! If the raster length is not a common divisor of the side lengths, a message pops up when loading the solution file. However, you can still load the solution file by clicking Yes.
|

For each of the sub-volumes the computed property value is written in the solution file. You can also observe the varying results when a different Raster Length is chosen.
