Results Tab
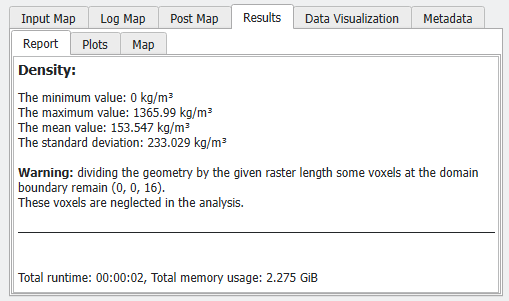
Report
In the Results - Report subtab, the minimal and maximal value of the chosen property found in any sub-volume are reported. Additionally, the mean value and the corresponding standard deviation are shown.
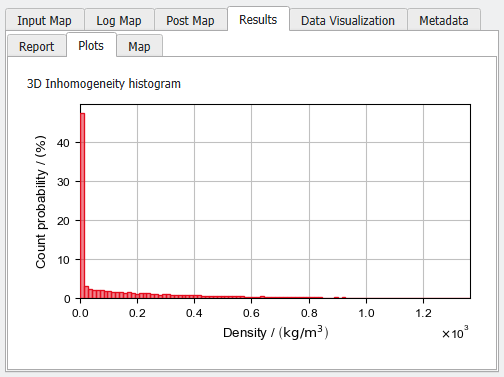
Plots
In the Results – Plots subtab, the histogram of the Count Probability of the selected property is plotted. It shows how much of the sub-volumes have certain property value. The number of bins in the histogram is fixed to 100, i.e., for analyzed Solid Volume Fraction or Porosity, the bin size is 1%. If Density is analyzed, the range of density values is divided in 100 equally sized bins.