Adding Graphs
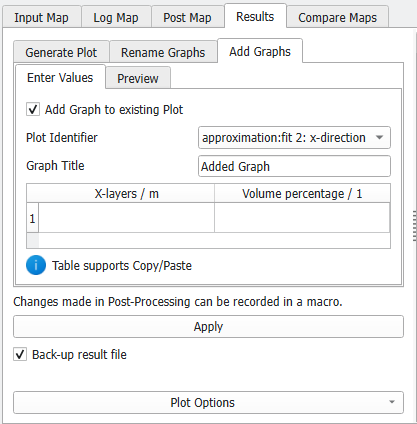
In the Add Graphs tab of the post processing panel new graphs can be edited to any plot - automatically generated or custom generated plot - in the combined result file. Check the box to activate the Add Graph to existing Plot options.
Select the Plot Identifier from the drop-down menu which defines the plot to which the graph is added. The name entered in Graph Title will be displayed in the plot legend.
In the following table the new values to be plotted are entered. The columns of the table show the Axis Label and Axis Unit for the X-Axis in the left column and for the Y-Axis in the right column, respectively. This table supports copy and paste, e.g., if the new data is stored in another file.
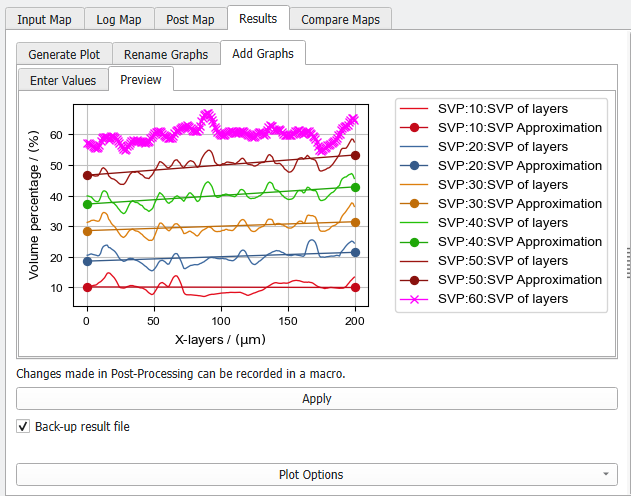
In the Preview subtab, check if all values are correct, then click Apply… to save the new graph to the selected plot.
 Example
For the example in Automatically generated Plots, we calculated the Thickness Estimation again for a structure with 60% solid volume percentage. We now include this graph into the graph from the combined result file. First, in the result file of the thickness estimation with 60% SVP, right click on the corresponding plot (Fit 2: X-direction) and choose Save Graph(s) as Text File(s). Change the data type to Table Files (*.csv) and choose a meaningful name. The value pairs plotted on the X- and Y-axis are saved for each graph in a separate file. The files get a numbered suffix in the order of the legend entries.
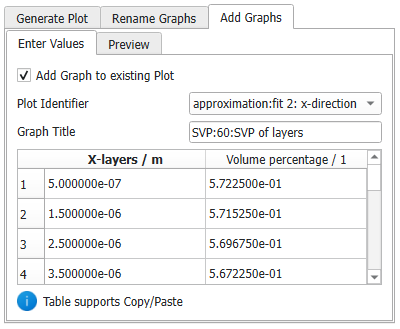
Open the csv files and copy the data. Then it can be pasted into the table in the Add Graphs – Enter Values subtab. Adapt the Graph title to the graph titles of the plot to which the graph is added.
In the Preview subtab, check if all values are correct, then click Apply… to add the first graph (here SVP of layers).
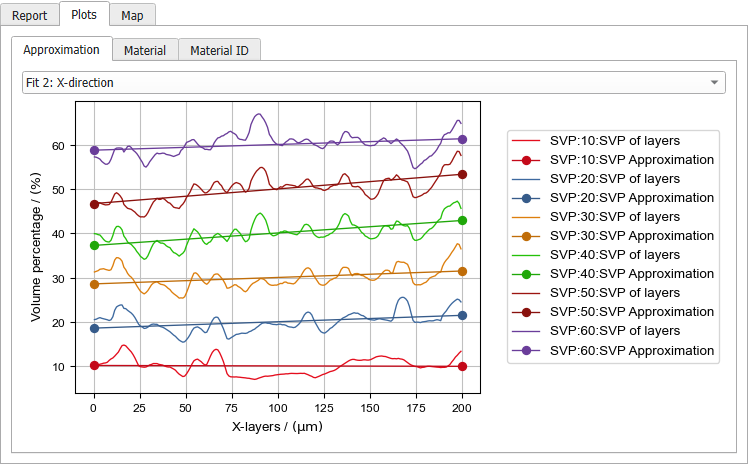
In the same way, add the SVP approximation graph.
The colors and styles can be changed later under Edit Graph Styles.
|