Save Options
The first section of the Plot Context Menu offers the possibility to save the plot data in different formats.
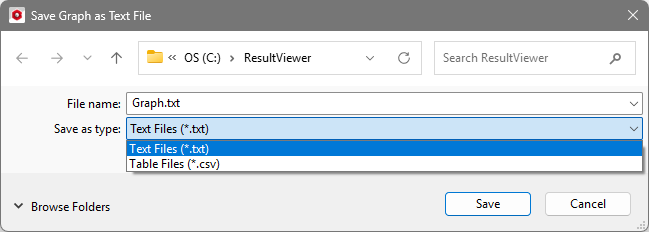
Save Graph(s) as Text File(s)
In the opening Save Graph as Text File dialog choose to write all graph points as *.txt or *.csv files. Each graph of the plot is saved in an individual text file.
Save Image
All plots can be saved as pixel (*.png) or vector (*.svg) image by clicking on Save Image. In the Save Plot dialog, choose the filename and the resolution of the saved image.
Via the Browse… button, choose the image format (*.png/*.svg) or simply type in the desired filename with suffix.
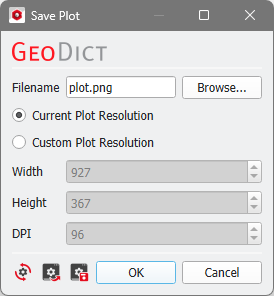
The Current Plot Resolution depends on the current size of the Result Viewer window and the values for Width, Height, and DPI (dots per inches) are entered automatically. With the Custom Plot Resolution option, these values can be freely chosen. Define a higher DPI value to increase font size and line thickness for better visibility, e.g., when using the plot for presentation slides.
Copy to clipboard (Ctrl + C)
Select Copy to clipboard (Ctrl + C) to copy the plot as image to the clipboard (or press Ctrl + C) and then paste it (Ctrl + V) where needed.