Data Visualization
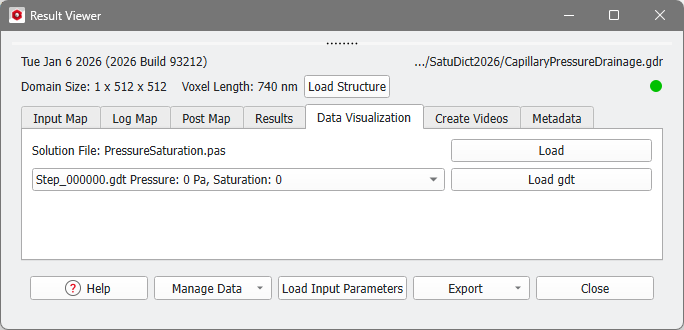
In the Data Visualization tab, you can load the *.pas file and the step-by-step images of the computed process.
Visualization of Pressure and Saturation (pas file)
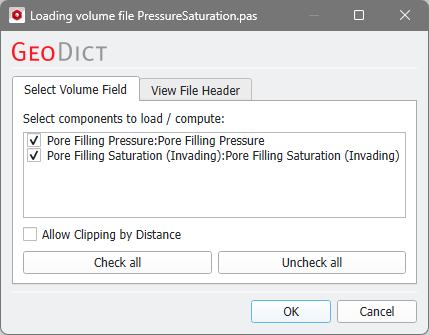
Click Load to access the pressure and saturation field data saved in the PressureSaturation.pas file.
Depending on the choice made in the Solver Parameters tab under the output options the Pore Filling Pressure and the Pore Filling Saturation (Invading) can be selected for the visualization. Click OK to load the selected fields.
The initial visualization, in 2D view or 3D rendering, is done using default settings which you can modify to visualize the imbibition and drainage results obtained with SatuDict.
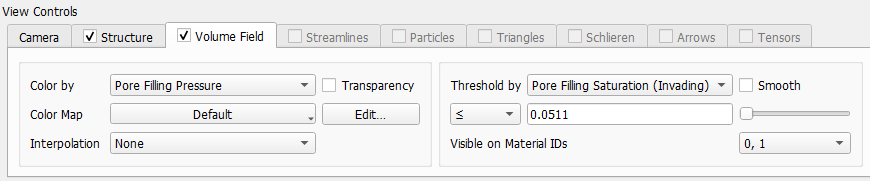
These parameters can be found under the Volume Field tab in the Visualization Panel, above the Visualization Area. For more information on a particular visualization setting, see the Visualization chapter.
Switch between the two components of the results (Pore Filling Pressure, Pore Filling Saturation (Invading)) through the Color By pull-down menu.
For the 3D rendering, we now present a clever way to visualize the data in the pressure and saturation solution file.
Select Pore Filling Pressure from the Color by and Pore Filling Saturation (Invading) from the Threshold by pull down menus.
With these settings, the voxels are displayed in the color corresponding to the pressure at which this voxel was filled. The volume field legend shows which color represents which pressure value. The pressure values are shown dependent on the saturation level of the invading fluid, because Threshold by Pore Filling Saturation is chosen. The Threshold slider combined with the Clip mode determines in which voxels the pressure is displayed:
- Threshold Slider / Box: The intrusion process is observed when moving the threshold slider from left to right or entering increasing values from 0 to 1 in the clip box. This parallels the increasing saturation of the invading fluid (from 0% to 100%) in the porous structure. The beginning of the process is observed with the slider all the way to the left. By moving it to the right or by entering increasing values in the threshold slider box, the intrusion process is visualized forward and at the end the clip slider is all the way to the right. Observe, that in the example shown here, the solution was computed till a saturation of 85%.
- Clip Mode: This makes the dual visualization of pressure values and distribution of phases possible because it links them based on the capillary pressure saturation curve.
- By selecting
 , color is shown in the pore space where the invading fluid occupies the structure only at a higher saturation than the Pore Filling Saturation (Invading) set in the threshold slider. This shows the locations where the displaced fluid is still in the structure at this saturation or below.
 - By selecting
 , color is shown in the pore space where the invading fluid is already present for a saturation below the value for Pore Filling Saturation (Invading) set in the threshold slider. This shows the locations where the invading fluid has already entered the structure and replaced the displaced fluid.
- By selecting
This leads to a twofold visualization, since for a given invading fluid saturation level (threshold value), the capillary pressure at particular locations in the structure is shown, together with the distribution of the two phases. While the color gradation refers to the capillary pressure values as displayed in the color bar, the distribution of the phases is given by the presence or absence of colored voxels in the pore space, without relation to the color bar scale.
The following are two examples of the effect of setting the Threshold slider/box and Clip Mode.
20% saturation of invading fluid
60% saturation of invading fluid
Visualization of intermediate states (gdt files)
Finally, the computed process can be visualized step-by-step with GDT files saved during the capillary pressure curve calculation. This is only possible if Write All .gdt or Write Only Changed .gdt was selected in the Solver Parameters tab. The GDT files corresponding to the computational steps (Step_000000.gdt, etc.) are stored in the automatically created result folder.
To analyze these results, make sure that the visualization of the Structure is switched on (View → Structure, in the menu bar).
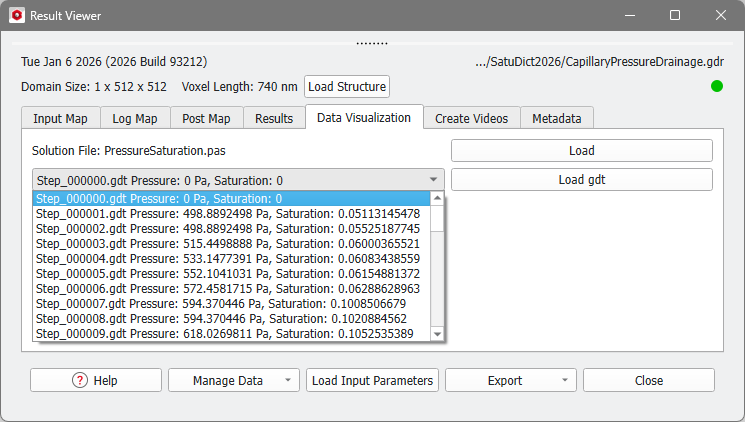
Select one of the GDT files, where the file names correspond to the simulation step in which the GDT file was saved. Also, the pressure und saturation of the invading fluid in this step are shown, which is the same as in the corresponding row of the table in the Results-Report tab.
Click Load gdt to open the desired file which is displayed in the visualization area.
The GDT file Step_000001.gdt (Pressure: 499 Pa, Saturation: 0.0511) corresponds to the beginning of the intrusion process. The structure appears (almost fully) saturated by the displaced fluid.
The GDT file Step_000049.gdt (Pressure: 2179 Pa, Saturation: 0.325) corresponds to an intermediate part of the intrusion process. The structure appears partly saturated by the invading fluid and the displaced fluid.