Results Tab
Report tab
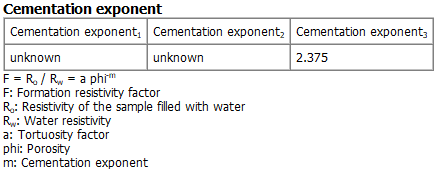
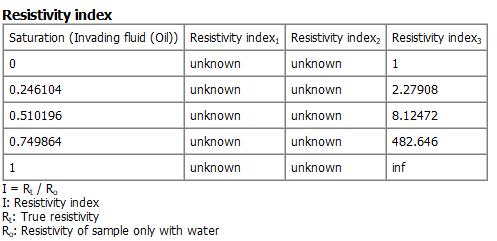
Under the Results-Report sub-tab, the tables for Saturation exponent, Cementation exponent, Resistivity index, and Relative Electrical Conductivity are shown for the chosen saturation rates (here, 0, 0.25, 0.50, 0.75, and 1), which are approximated as best as possible (here, 0, 0.246104, 0.510196, 0.749864, and 1).

 Relative Electrical Conductivity

Plots tab
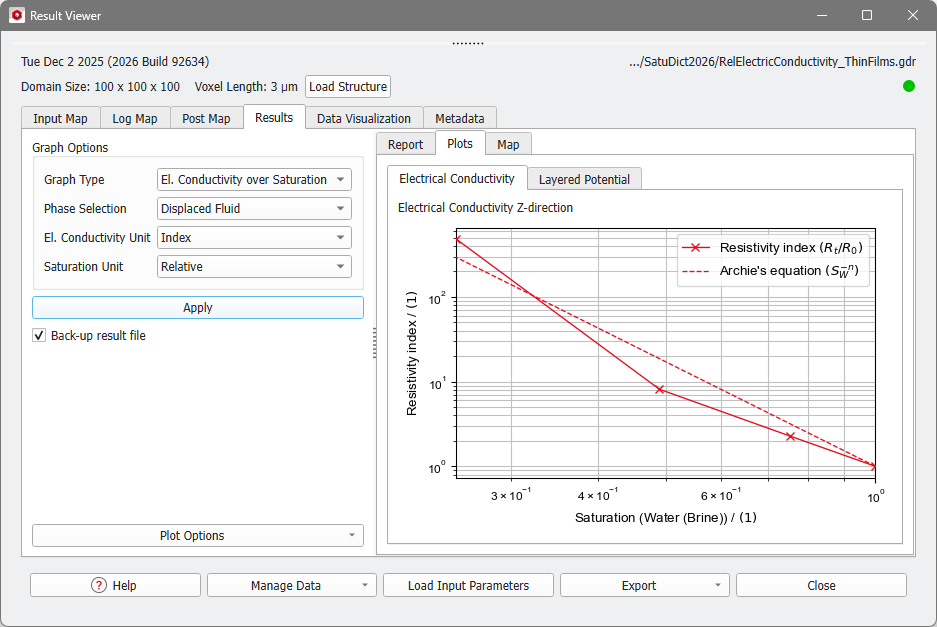
In the Results-Plots subtab, the values of the Relative Electrical Conductivity table are shown in a graph. Also, the Layered Potential in the computed directions is given.
Electrical Conductivity Plot
The values of the electrical conductivity in all selected Computational Directions at the different saturation levels are shown in a graph.
On the left, the Post-Processing Widget allows you to fine-tune the Electrical Conductivity plot. Collapse the Post-Processing Widget by pulling it to the left.
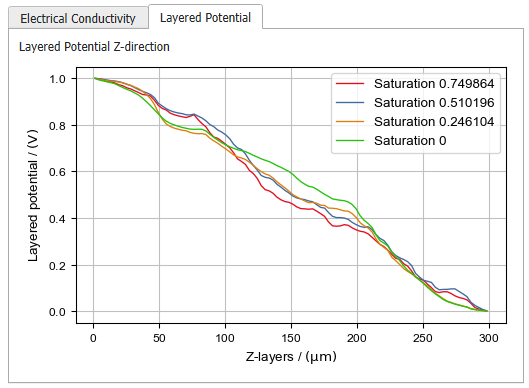
Layered Potential
In the Layered Potential tab for each computational direction the potential in each layer is shown in a graph. The saturation values for each graph correspond to the saturation of the invading fluid. The settings made under the Graph Options do not apply for these plots, but the axis settings and graph styles can be changed under Plot Options.
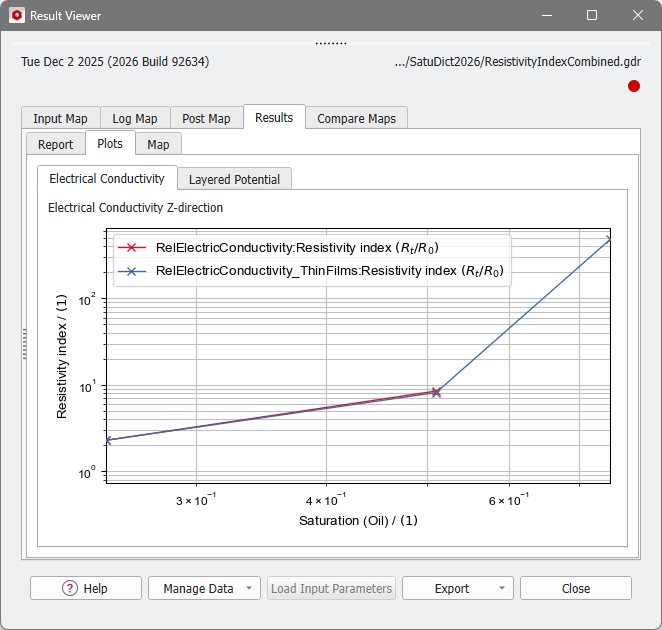
Influence of Thin Films
We redo the computations, but without adding thin film voxels and compare the plots of the resistivity index using a combined gdr file. Observe that for the structure without thin film voxels there is no conductivity above an oil saturation of about 50%.