Result fields contain property data from simulations. Many of the analysis and all of the simulation and prediction modules write 3D result fields. For the 2D view, three different kinds of result fields can be visualized: Volume Field, Schlieren and Arrows.
There are two ways to open a result field. The first, and most common, way is loading them from the Result Viewer, as described in the Result Viewer User Guide. Another way is via the File menu (File - Load Volume File).
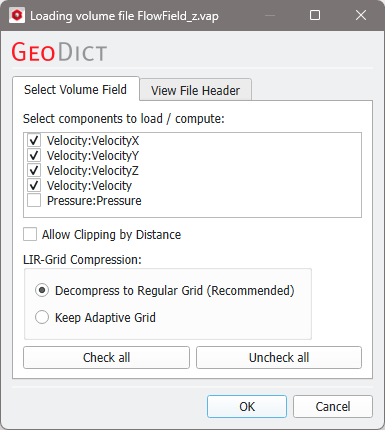
When loading a volume file a dialog shows up, where you can choose the components whose results you want to visualize.
As part of the visualization of the flow field, several GeoDict modules, e.g., FilterDict or FlowDict, can also display the streamlines left by the fluid when flowing through the structure, an arrow field for the flow, and the schlieren produced when the fluid flows through the structure (see Schlieren imaging for more info). For visualizing streamlines, schlieren, or arrows a complete vector field needs to be loaded, i.e., all components of one image, for example all Velocity components for a flow simulation.
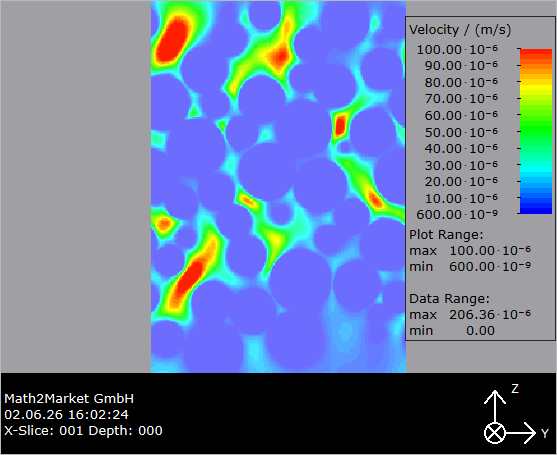
Now, the display in the Visualization area changes and additionally shows the loaded data. The value range is indicated on the color bar of the Volume Field Legend that appears to the right (default position).
It may be useful to switch off the structure and the display of the Material Legend (View → Legends / Overlays → Material Legend in the menu bar or in the GUI Sidebar).
|
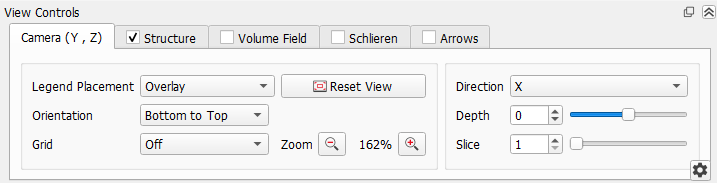
 in the toolbar. Five tabs are present to control the 2D Cross Section View settings: Camera, Structure, Volume Field, Schlieren and Arrows.