Volume Field
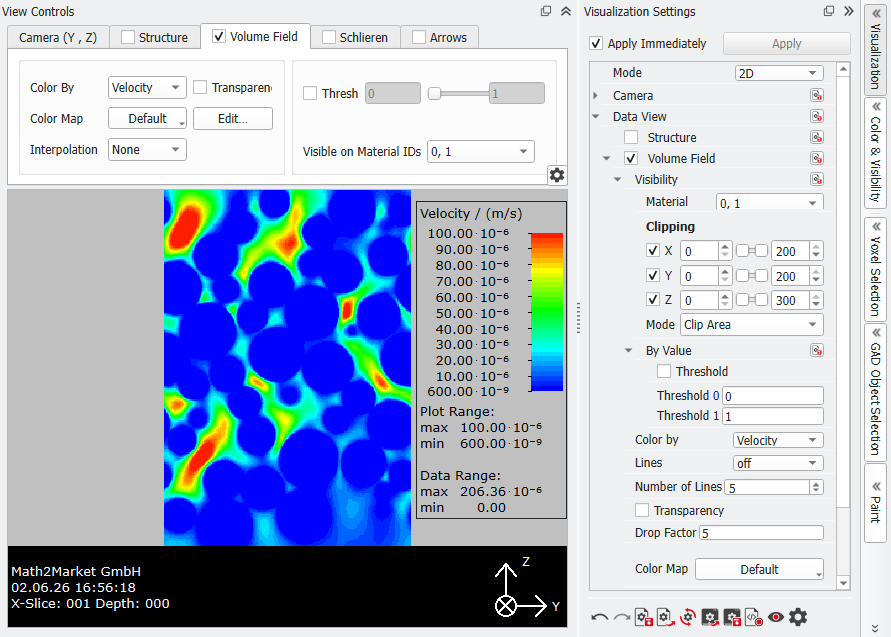
The parameters that control the visualization of the volume field in 2D are under the Volume Field tab of the View Controls and, with a few more choices, in the GUI Sidebar under the Data View u Volume Field tree as well.
 Color By
Choose the component to be rendered through the Color By pull down menu.
|
Color Map and Transparency
Define the color range and which values should be transparent. For a more detailed explanation see here.
|
Interpolation
In 2D mode the volume field colors cannot be interpolated. Thus, only None is selectable from the pull-down menu for Interpolation. The different interpolation options are described for the 3D mode.
|
Threshold
Checking Threshold allows a clipping that is not related to the spatial coordinates but to the visualized data range. The areas with values between the respective threshold values appear white/transparent This might be used, for example, to visualize only the flow velocity values between 0.00006 (6e-05) m/s and the maximum of 0.0002 (2.05e-04) m/s. In the Visualization Settings dialog, find the option as Visibility → By Value → Threshold.
|
Visible on Materials IDs
In the View Controls or the Visualization Settings dialog, choose the Material IDs in which the volume field is visualized. This helps in better observing a value of a computed component of the volume field. To do so, select these materials from the Material ID’s pull-down menu.
By default, all Material IDs present in the structure are selected.
In the case shown here, the flow only happens in the pore space (here, Material ID 00), since the fluid in the structure does not flow through the solids (here, Material ID 01). The flow velocity is displayed in the space occupied by Material ID 00. The flow velocity is not displayed when Material ID 00 is disabled.
|
Clipping
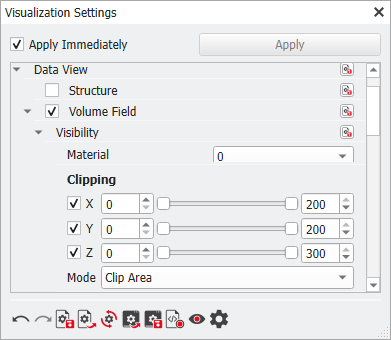
In the Visualization Settings dialog under Visibility you can also clip the volume field as shown for the structure.
|
Lines
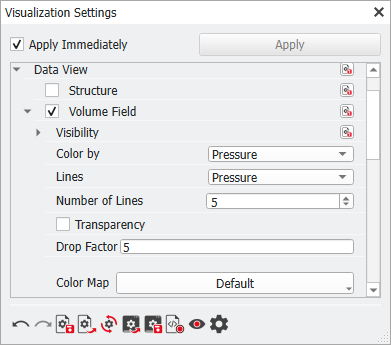
Points of equal value of the selected local field can be visualized as cross-sections of isolines (appearing as black lines) when changing the default selection Lines→ off in the Visualization Settings dialog (Data View u Volume Field u Lines).
Choose the result field component for the lines. It is also possible to visualize for example the velocity colors, while visualizing the Pressure lines. This gives the possibility to look for correlations.
Enter the desired Number of Lines and modify the appearance of the lines through the value Drop Factor. Smaller values for Drop Factor result in larger line shadows, while higher values lead to smaller shadows.
|