Results
After the Identify Pores calculation is finished, the resulting files are saved in the project folder and a Result Viewer with the GeoDict result file opens automatically. The created GeoDict result file (*.gdr) contains six tabs. The computational results are shown under the Results tab, and can be loaded for visualization via the Pore Visualization tab. The other four tabs (Input Map, Log Map, Post Map, and Metadata) display additional information about the computation.
Find more details on the general functionalities in the Result Viewer user guide.
The Results tab is the central point for the analysis of the identified pores. It is grouped in three subtabs: Report, Plots, and Map. The Report tab shows statistics about the identified pores and the Plots tab contains plot options for the analysis of the results. The Map tab contains all resulting data from the Identify Pores run. This data is the basis for the tables in the Report tab and for the plots in the Plots tab. On the left, the Post-Processing Widget allows you to fine-tune many graphs of the Plots tab. Collapse the Post-Processing Widget by pulling it to the left.
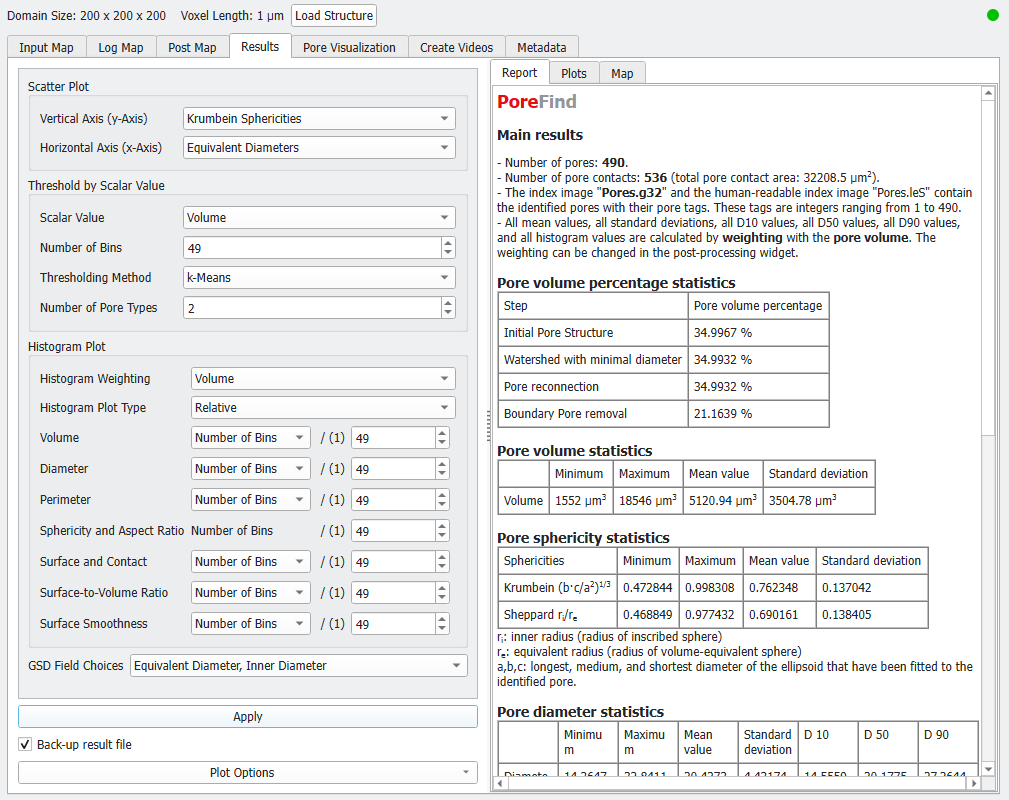
Post-Processing Widget
Scatter Plot
In the Scatter Plot panel, you can choose two scalar values to be plotted against each other. By default, the Krumbein Sphericity is plotted against the Equivalent Diameters.
Find out more about the Scatter Plot in the Plots topic.
Threshold by Scalar Value
In the Threshold by Scalar Value panel you can choose a scalar value and a thresholding method to classify the pores into a selected number of types.
Find out more about the Threshold by scalar value plot in the Plots topic.
Histogram Plot
Define the options for the histograms in the Plot tab in the Histogram Plot panel. The Weighting and Plot Type are equal for all histograms, while the bin number can be set individually.
Find more about the Histogram Plot Options in the Plots topic.
GSD Field Choices
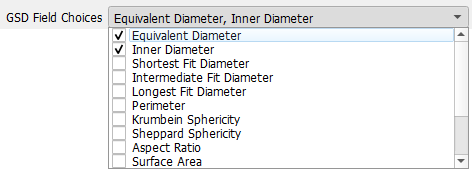
From the drop-down menu choose the scalar pore properties that you want to visualize. For every chosen pore property, a volume field is created containing the 3D distribution of this property. These volume fields are saved together in a *.gsd file (GeoDict size distribution). Load this file in the Pore Visualization tab under Load Pore-Size Distribution.
In the example below, where Equivalent Diameter and Inner Diameter were chosen, the *.gsd file will contain two volume fields: one with the size distribution of the diameters of volume-equivalent spheres, and one with the inner diameter.
Identify Pores Results: |
|---|
|
