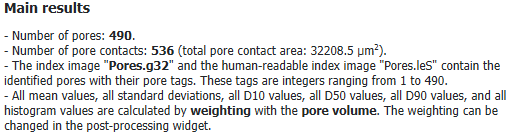
The Report tab shows the Main results at the top, and below, in several tables, more detailed statistics. For an explanation of the different computed properties see Results of Identify Pores.
In the Main results section, the number of identified pores and the number and total area of pore contacts is given. For the *.g32 file (and for the *.leS file if Save Pore Index Image as *.leS was checked in the Output Options tab) the range of the index numbers is stated. Below, for the mentioned statistical values, the weighting property is given. This is the same as entered for Histogram Weighting in the Output Options tab, but you can also change it later in the Post-Processing Widget under the Histogram Plot Options.
In this table, the pore volume during the different steps of the identification is displayed. The pore volume percentage after the Watershed transformation is only shown if Current Structure was chosen as Input Mode. Then, only pores larger than the minimal pore diameter count for the statistics. The volume percentage after Pore-Fragment Reconnection and Boundary Pore removal are only shown if the corresponding options were selected in the options dialog.
For the identified pores, the minimum, maximum, and mean volume and the standard deviation are shown. The mean value and standard deviation are weighted with the chosen Histogram Weighting (changeable in the Post-Processing Widget).
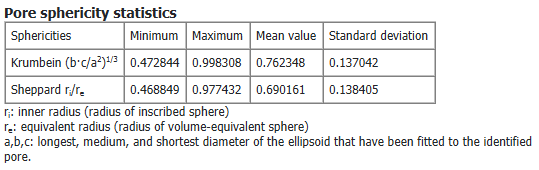
The statistics for the Krumbein sphericity and the Sheppard sphericity (only if Save Inscribed-Sphere Diameters and Sheppard Sphericities was checked in the Output Options tab) are shown. The mean value and standard deviation are weighted with the chosen Histogram Weighting (changeable in the Post-Processing Widget).
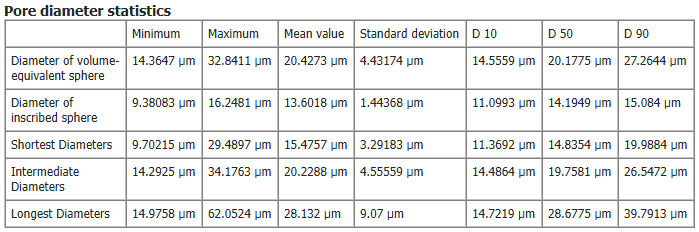
For different pore diameters the minimum, maximum, and mean value and the standard deviation are shown. The mean value and standard deviation are weighted with the chosen Histogram Weighting (changeable in the Post-Processing Widget). Additionally, the characteristic diameters D10, D50, and D90 are shown. These are the diameters such that 10%, 50%, or 90% of all pores have smaller diameter than the corresponding value. The Diameter of inscribed sphere is only computed if Save Inscribed-Sphere Diameters and Sheppard Sphericities was checked in the Output Options tab.
For the coordination number (number of contacts a pore has to other pores) the minimum, maximum, and mean value and the standard deviation are shown. The mean value and standard deviation are weighted with the chosen Histogram Weighting (changeable in the Post-Processing Widget).
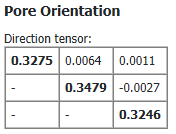
At the bottom, the orientation tensor of all pores is shown.
In detail, let
be the unit vector describing the direction of the k-th object and n the number of objects. Then the orientation tensor T is the sum over the dyadic products of the dk from all n objects, divided by n:
(60) Orientation Tensor
The diagonal elements define the orientation strength for the corresponding directions and sum up to 1. Thus, if for example t11=1 (and t22=t33 =0 ), all objects are oriented in the X-direction. For t11=0 all objects are oriented normally to the X-direction and same values for all diagonal elements (t11=t22=t33= 1/3)) result in a uniform distribution for the object orientation.
 Pore volume percentage statistics