Visualize and animate the particles moving through your structure.
The Particles visualization tab is automatically enabled when trajectories or final particle positions are loaded. You can visualize the movement of a particle when you have loaded its complete trajectory. If you have loaded only the final position of a particle, the movement is not visualized, but it will appear at its final position.
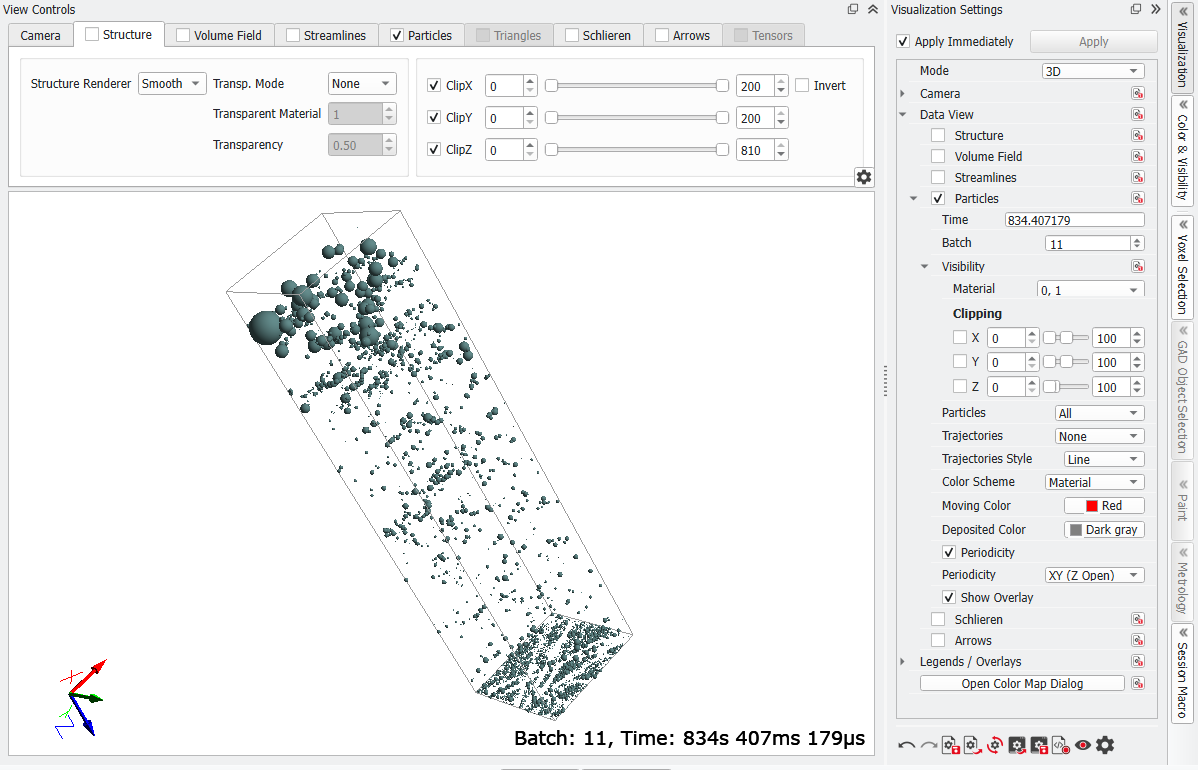
The most important settings for the particle visualization can be accessed through the Particles tab. Additional options are found in the Visualization Settings dialog. Expand the Visualization Settings dialog either by clicking the gear wheel icon in the bottom right of the Particles tab or by opening the Visualization tab in the sidebar and unfolding the Data View → Particles section.
Click the ParticleVisualization tab. Buttons in three panels give access to the visualization of particle trajectories, the visualization of the particle positions with time, the visualization of the deposited dust with time and the visualization of the fluid flow field.
In the Particles panel, move the slider to select the Batches of particles to be visualized. For example, keep the choice to visualize all batches that ran in this filtration simulation, which is batches 1 to 13 in the example.
Select Trajectories to animate the particle motion from inflow to outflow or deposition place. If a large number of particles was simulated, loading all the trajectories at once is memory consuming and may not be possible. Loading only the Final positions does not allow to animate the particle motion, but is less memory consuming. Memory consumption may also be reduced by visualizing only a fraction of the simulated particles per batch by loading only Every n-th Particle.
Then, click Load Particles.
The structure model appears in the Visualization area in 3D Rendering with the stationary particles of Batch 1 above the structure (at the inlet domain).
Animation Controls
In the View Controls , the sliders for Time and Speed Ratio control the visualization of particle movement.
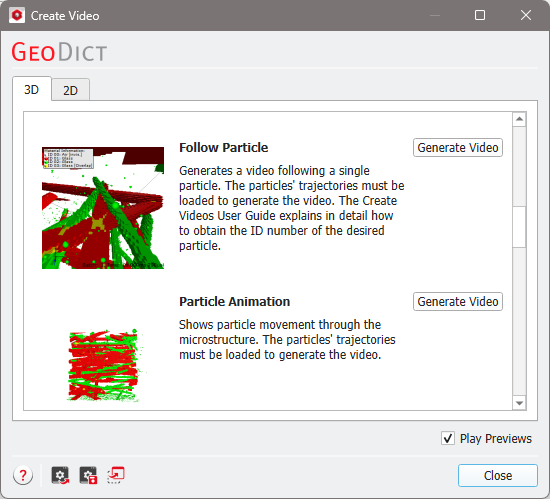
You can also generate videos using the Create Video dialog (File - Save Video as). Select the Follow Particle preset or the Particle Animation preset and click Generate Video. How to create videos in GeoDict is explained in detail in the Create Videos chapter.
The Speed Ratio controls the visualization speed by entering values directly or by moving the slider. Low values of Speed Ratio result in the particle movement process being shown in slow motion, whereas high values lead to faster motion.
The animation of the particles, in which the particles move through the filter structure, starts by clicking Play. The Batch number changes from 1 to the last batch, as the batches of particles appear in the inflow region above the filter media model and pass through it. The bigger particles are caught and held by the filter material whereas the smaller ones pass through to reach the outflow region.
Below, two images of batches 6 and 12 are shown. The color of the particles hovering over the structure has been changed from the default green to red. The deposited particles are shown in dark gray.
The Time slider does not return to zero when the animation has finished and must be set to the initial value to restart the animation. However, checking Loop makes the animation play endlessly.
Checking Short Time adapts the visualization Time to the period when most of particles move. This option cuts off the final part of a simulation where only a few particles move at very low velocities and virtually no changes are visible to the observer.
Checking Periodicity activates periodic boundary conditions for the visualization of the simulation results. This is only recommended if the simulation was also done with periodic boundary conditions. In the Visualization Settings dialog, select where to apply periodicity from the pull-down menu for Periodicity. If for example, XY (Z Open) is selected, the periodicity is only applied in X- and Y- direction, while the Z-direction is open for particle movement.
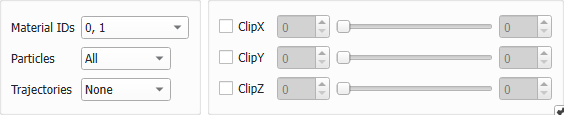
The Particles and Trajectories pull-downmenus can be set to:
None to show no particles (or no trajectories).
Filtered to show only the filtered particles (or their corresponding trajectories).
Not Filtered to only show the particles that are not filtered (or their corresponding trajectories).
Time Out to display only particles (or their corresponding trajectories) whose movement could not be simulated completely within the time defined for each batch. For example, in some cases, a few particles can have very small velocities in the inflow region compared to most of particles and therefore their behavior cannot be simulated completely within the defined batch time.
All to show all particles.
Custom. This option is only available in the Particles pull-down menu, but also applies for trajectories. If selected, click Edit Custom to define the particle visualization as described here.
Clip the particle visualization area by enabling a clip direction, and moving the corresponding sliders or entering clipping values, working the same way as for the Structure.
In the Visualization Settings dialog (Data View uParticles), control the Color Scheme by selecting between the following options from the pull-down menu:
Moving State: If selected the default green color of the non-filtered particles can be changed with the parameter Moving Color. The color of the filtered particles can also be changed from the default dark graywith Deposited Color.
Material: The colors are selected automatically depending on the material.
Size: The colors are selected automatically depending on the particle size.
Batch ID: The colors are selected automatically depending on the batch ID.
Residence Time: The colors are selected according to the time spent in the chosen Materials.
Bounces: The colors are selected depending on the number of bounces from the selected Materials.
Entries: The colors are selected depending on how often the particles enter the chosen Materials.
Trapped: The colors are selected depending on the material they are trapped in.
Sometimes it is useful to switch off the visualization of the structure by deselecting Data View u Structure.
At the bottom-right of the visualization area, observe the Batch number and the point in Time of the filtration process. Determine if they should be shown or not by enabling / disabling the checkbox Show Overlay in the Particles section of the Visualization Settings dialog. The font size and color can be changed as described in the Legends / Overlays section.
Custom Visualization of Particles
The display of the particles moving through the structure and their trajectories can be customized.
When choosing Custom for the visualization of Particles, the Edit Custom… button overlays and replaces the standard Trajectories pull-down menu described above. Now, the visualization of trajectories is controlled through the Visualization - Trajectories option of the Custom Particle Selection dialog.
Settings for a user-defined, customized visualization can be defined by clicking the Edit Custom… button. Alternatively, the same dialog can be accessed by clicking Open Custom Particle Dialog in the Visualization Settings panel.
The Custom Particle Selection dialog opens. The dialog may remain open to observe the changes that the selections have on the visualization of particles moving through the structure. The custom particle options can be changed while the particle animation is playing, so that the effect of the selection can be observed immediately.
Clicking Add Selection generates Selection 1. The selection can be disabled by unchecking the corresponding checkbox or deleted by clicking Remove.
Clicking at the left of Selection 1 opens the options: Previous Batches, Diameter Selection, ID Selection, Type ID Selection, Final State, Deposition Zone, Multiplicity, and Visualization.
Parameters for all these options are accessed by clicking on their symbol.
Clicking Add Selection again makes a new selection appear (e.g., Selection 2), to combine different visualization selectionmodels. It is useful to observe, for example, particles with two different diameter ranges (through Diameter Selection).
As an example, here, we show the settings to visualize particles with a diameter from 3 µm to 5 µm in Dark red, and particles with a diameter of 5 µm to 10 µm in Dark cyan.
Particles with a diameter larger than 10 µm and smaller than 3 µm are not shown at all.
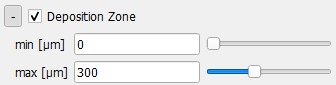
Here, only particles with a Deposition Zone between 0 µm and 300 µm will be visualized.
The particles are scaled with Diameter Factor 3 to see the particles better.
If Previous Batches is unchecked, the selection applies only to the current batch.
When Previous Batches is checked, the selection only applies to the particles deposited in previous batches. The selection does not apply for the current batch (the particles currently in motion in the visualization).
Checking Diameter Selection limits the visualized particles to those with a particle diameter in the range specified by min and max. This option only has an effect if the particles exhibit a particle size distribution.
Every particle has a specific ID and a specific Type ID. Every particle is counted and has its own specific ID. Furthermore, every diameter has its Type ID, which means that if you have 30 different diameters, there are 30 different Type IDs.
This option limits the visualized particles to those with a particle ID / Type ID in the range specified by min and max.
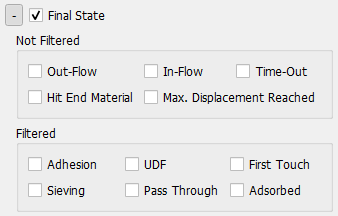
Final State enables the visualization of particles that obtained a particular state at the end of the simulation.
In the Not Filtered panel, particles that did not get attached to the filter/porous medium are selected as follows:
Out-Flow denotes particles that left the computational domain via the fluid outflow region.
In-Flow designates particles that left the computational domain via the fluid inflow region.
Time-Out identifies all particles which are still moving at the end of the time interval that corresponds to this batch.
Hit End Material only shows particles which hit the end material. This only applies if the Particle End Position in the simulation is set to material ID and not to the outflow plane.
The Max. Displacement reached state can only be achieved in AddiDict.
The Filtered panel contains the options for particles that became attached to the filter/porous medium:
Adhesion selects all particles that are filtered by the adhesion (Hamaker) model.
UDF selects all particles that are filtered by a model from a user defined function, which sets the trapCode to 33 (see Collision UDF). UDFs are only available in FilterDict.
First Touch selects particles that are filtered by the caught on first touch model.
Sieving selects particles that are filtered by the sieving model.
Pass Through selects particles that are filtered by the pass-through model.
Adsorbed selects particles that were adsorbed in a porous medium. The adsorption model is only available in AddiDict.
The Deposition Zone defines a location in the computational domain where the particles must be situated at the end of the simulation to be eligible for visualization. This zone is delimited by the min / max coordinates of the Cartesian direction in which fluid flow occurs, i.e., Z-axis.
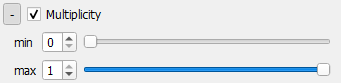
Particles can be selected depending on their multiplicity. Particle Multiplicity is a simulation option for unresolved particles which helps reducing simulation time for very small particles. For detailed information see the FilterDict chapter.
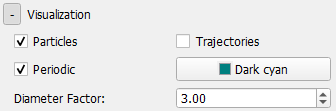
Checking Visualization allows more adjustments for the visualization of simulation results.
Checking Particles displays all particles that conform to the options previously set in the dialog.
Checking Trajectories displays the trajectories which correspond to the selected particles. With this option, it is (for example) possible to show only the trajectories which correspond to a certain particle type.
Checking Periodic enables periodic boundaries for the particle movements display. Particles which leave the domain at one side re-enter at the opposite side.
The default color green for the particles can be changed to another color through the button (for example, Dark cyan).
The Diameter Factor scales the particles sizes relative to their original size for visualization purposes and enables the display of particles that are nominally below the visibility of the visualization settings. The diameter of all particles moving in the simulation artificially grows by this factor when visualizing them.




 at the left of Selection 1 opens the options: Previous Batches, Diameter Selection, ID Selection, Type ID Selection, Final State, Deposition Zone, Multiplicity, and Visualization.
  Dark red, and particles with a diameter of 5 µm to 10 µm in
  Dark cyan.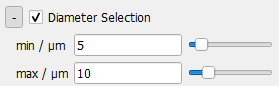

 Dark cyan).