Visualization 3D
A structure appears in the Visualization area after loading a file (*.gdt, *gad). Then, select View → 3D Rendering in the menu bar or click  in the toolbar.
In the View Controls, above the structure displayed in 3D, up to nine tabs are selectable to control the 3D view settings: Camera, Structure, Volume Field, Streamlines, Particles, Triangles, Schlieren, Arrows and Tensors.
The grayed-out tabs correspond to the visualization of property data from result files. They become available when corresponding result files are loaded. Many of the analysis and all of the simulation and prediction modules write 3D result fields.
The following tabs are available in 3D view:
|
- Camera
Set the camera settings, as camera position and lighting.
- Structure
The Structure tab is always selectable and checked by default when a structure is loaded.
- Volume Field
Visualize many kinds of result data in 3D, for example velocity, ion concentration, diffusion flux and many more.
- Streamlines
Visualize the flow through your structure with streamlines or even animated streamlets.
- Particles
Visualize and animate the particles moving through your structure .
- Triangles
Visualize surface meshes in stl format in GeoDict.
- Schlieren
Visualize fluid flow fields through line integral convolution.
- Arrows
Visualize flow via arrows.
- Tensors
After performing a flexural test, you can visualize the tensor field.
|
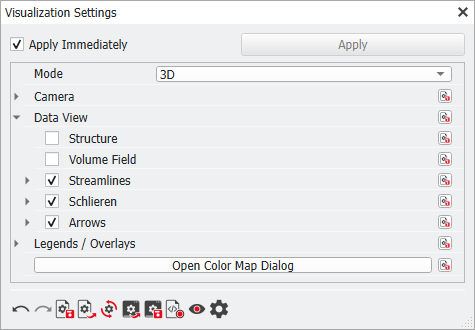
For beautiful visualizations, also more fields can be visualized at once, by enabling the checkboxes of the corresponding tabs in the View Controls, or in the Data View section of the Visualization Settings, or in the View menu. To obtain a nice visualization with more than one of the data elements, for example by clipping them in parts, or if the volume field is turned on, enable Transparency in the Volume Field tab and adjust the transparency settings in the Color Map dialog. In the image below, the structure is clipped halfway in X-direction, the volume field is set to transparent, and the streamlines are enabled.
 Open result fields
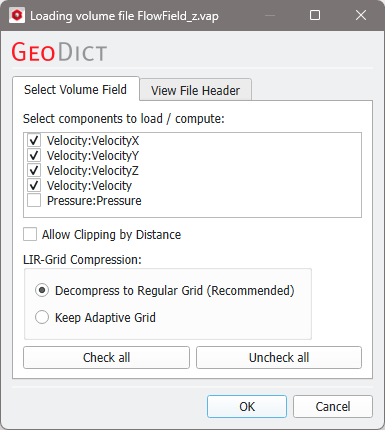
There are two ways to open a result field. The first, and most common, way is loading them from the Result Viewer, as described in the Result Viewer User Guide. Another way is via the File menu (File - Load Volume File).
When loading a volume file a dialog shows up, where you can choose the components whose results you want to visualize.
As part of the visualization of the flow field, several GeoDict modules, e.g., FilterDict or FlowDict, can also display the streamlines left by the fluid when flowing through the structure, an arrow field for the flow, and the schlieren produced when the fluid flows through the structure (see Schlieren imaging for more info). For visualizing streamlines, schlieren, or arrows a complete vector field needs to be loaded, i.e., all components of one image, for example all Velocity components for a flow simulation.
Simulating a flexural text using the ElastoDict module, it is possible to visualize the tensors. For this also a complete vector field must be loaded, e.g., all strain or all stress components.
|
Choose which components to visualize
The initial default visualization after loading can be optimized by modifying the parameters under the corresponding tabs in the View Controls, above the Visualization area.
Check these tabs to make their options selectable. At the same time, to only visualize the selected data components, turn off the visualization of the other components by unchecking the corresponding tabs. If needed, also switch off the display of the structure model.
This can also be done through the View menu or through the Visualization Settings dialog, as follows:
As soon as a component is checked, it is shown in the Visualization area, and the parameters needed to set their visualization can be modified.
|