|
Navigation: GeoDict 2026 - User Guide > Image Analysis > MatDict > GAD Objects Analysis > Analyze Objects > Results |
Scroll |
Results Tab
The content of the Results tab differs, depending on the origin of the Object Data and the chosen Analyze Options.
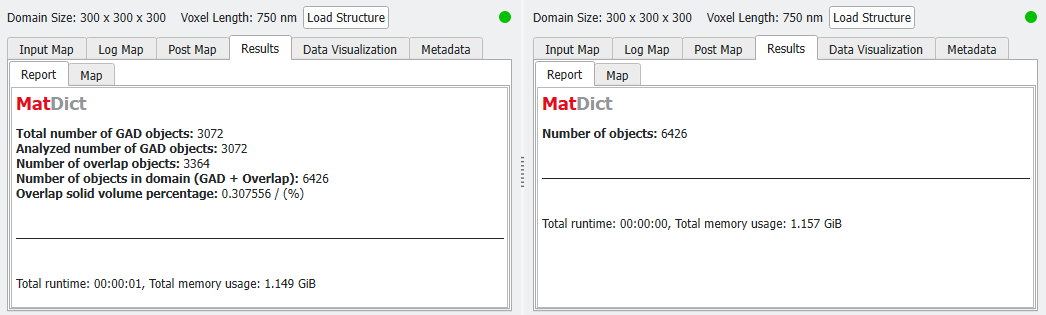
Left: Use Current GAD Structure
Right: Use Current Index Image
 Results for Use Current GAD Structure
In the Results - Report subtab, the following values are reported:
The resulting numbers depend on the way overlapping objects are treated. How overlap is handled is typically defined at the creation of the structure but can also be modified later using the Edit Domain command from the GAD Objects context menu in the status section. 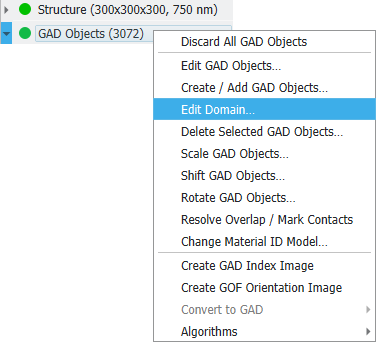 |
Results for Use Current Index Image
In this case, only the number of objects is reported. No overlap is present in index images as each voxel is assigned to a unique index. In this example, each overlap object has its own index. |
Results for Analyze Object Contact
If Analyze Object Contact was checked in the Analyze Options tab, the total number of contacts and the mean coordination number are additionally reported in the Contact section of the report.  Here, the Mean Coordination Number is defined as: A histogram of the coordination numbers is added to the Results - Plots subtab. 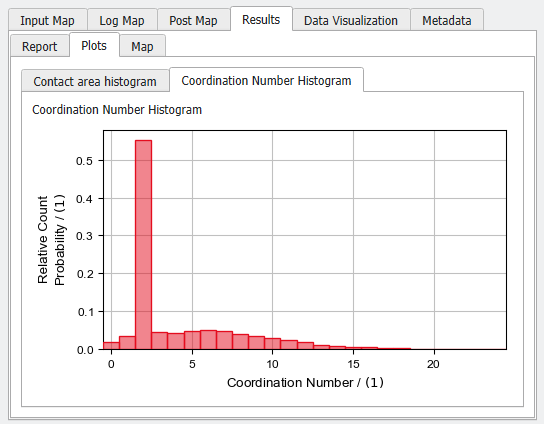 Its functionality is identical to the coordination number histogram in Identify Grains. More detailed results for all contacts are available under the Results - Map subtab: 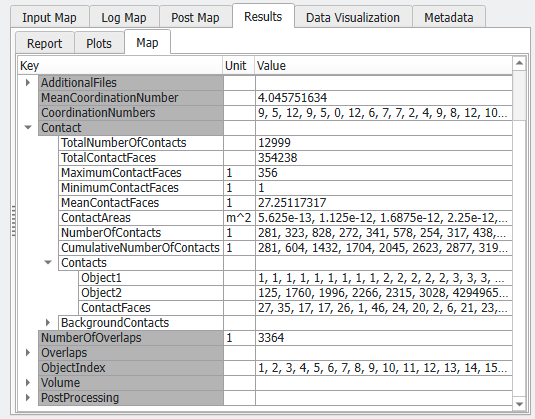 Under the Contacts key, for each contact the index numbers of both objects and the number of contact faces are given. In the above example, the first contact is between object number 1 and object number 125 and has a size of 27 voxel faces. The second contact is between object number 1 and object number 1760 and has a size of 35 voxel faces. Under the Results - Plots subtab, the Contact Area Histogram visualizes the size distribution of the contact areas: 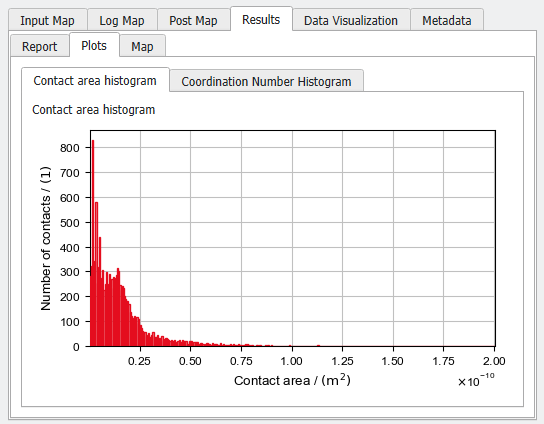 |
Results for Analyze Object Volume
If Analyze Object Volume was checked in the Analyze Options tab, the minimal, maximal, and mean volume are stated in the Object Volume section. 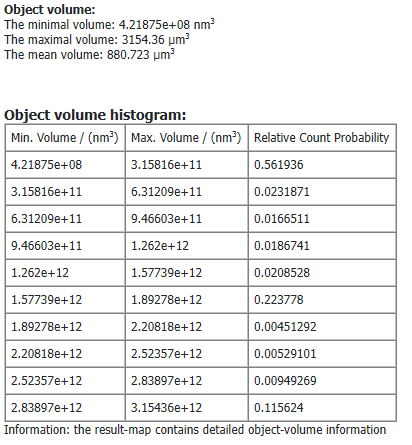 Furthermore, an Object volume histogram table is created based on the Volume Histogram settings defined in the Options dialog. The object volume histogram is graphically shown under the Result - Plots subtab. In the plot, the values for each bin are visualized as bars. 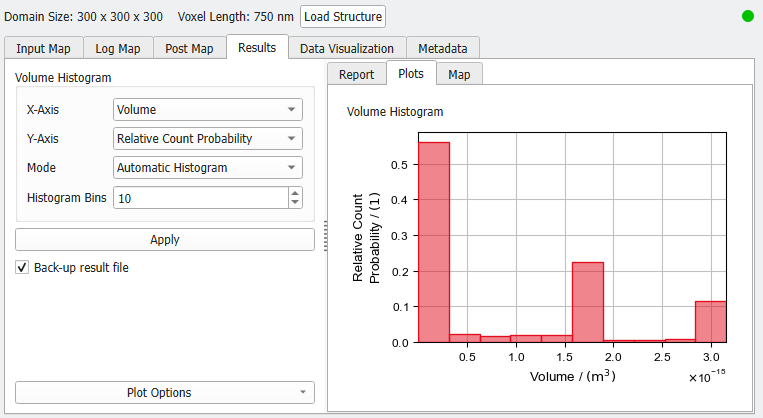 You can edit the volume histogram afterwards in the post-processing panel on the left-hand side of the Report tab. The table and plot update when you click the Apply button after changing the parameters. More parameters can be defined by clicking Plot Options at the bottom of the panel and choose Edit Axis Settings or Edit Graph Styles for the desired plot. See also the Result Viewer user guide for detailed explanations. |
The X-Axis pull-down menu allows choosing whether the components should be classified based on volume (Volume) or based on volume equivalent sphere diameter (Equivalent Diameter).  For the Y-Axis pull-down menu, the Relative Count Probability provides the number of components in each bin normalized to the total number of components. The Cumulative Count Probability is the sum of the Relative Count Probability over all bins starting from the bin with the smallest value. Relative Volume Probability gives the volume of the components within one bin normalized to the total volume of all components. The Cumulative Volume Probability sums up the Relative Volume Probability of each bin of the histogram starting from the smallest one. 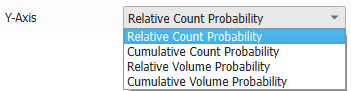 The histogram Mode offers the choice between generating an Automatic Histogram without further specifications or to Give Min. and Max Value for the parameter defined in the X-Axis pull-down menu (Volume or Equivalent Diameter).  In the latter case, either Min. Volume and Max. Volume or Min. Diameter and Max. Diameter (depending on the choice for X-Axis) can be directly entered here. 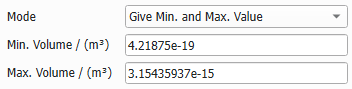 The number of Histogram Bins determines the number of rows in the Object Volume Histogram table and the number of bars in the plot.  |
©2026 created by Math2Market GmbH / Imprint / Privacy Policy
