Capillary Pressure with Hysteresis Effect
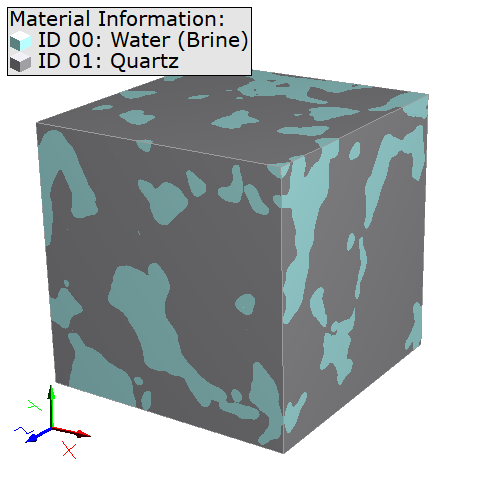
A generalization of the pore morphology method allows considering structures in which the invading fluid is already present in the structure. This makes the simulation of primary and secondary drainage experiments possible, as well as primary and secondary imbibition experiments. We illustrate this Hysteresis effect on the structure shown below, which has 17% porosity and is saturated with Water at the beginning.
First, a primary drainage simulation is done with the following settings.
To perform a follow-up imbibition simulation, the final state of the previous drainage simulation (Step_000053.gdt with 93333 Pa) is loaded from the Data Visualization tab in the result viewer as starting state for the imbibition simulation.
Then, open the Capillary Pressure Curve Options dialog to change the parameters for the imbibition simulation. Change the name for the result file from CapillaryPressureResult_1_Drainage.gdr to CapillaryPressureResult_2_Imbibition.gdr.
In the Constituent Materials tab, select the Invading Fluid to be Water (Brine) and the Displaced Fluid to be Oil. Set the Invading Fluid CA to 30°, the contact angle for the displaced fluid will automatically be changed.
Under the Saturation Experiment tab, the Experiment has automatically changed to Imbibition. Check that Invading Fluid must be connected to a Reservoir is selected. In this example we leave the Dynamic Pore Morphology Method unchecked.
In the Boundary Conditions tab, switch the reservoirs boundary conditions of invading and displaced fluid in Z-direction.
Confirm the settings with OK and click Run in the SatuDict section to start the simulation.
The Result Viewer of the result file opens at the end of the computations. Load the GDT files as explained in Data Visualization to observe the imbibition process.
Observe that, step-by-step, the oil is displaced by the invading water, which reconnects with the water previously trapped in the structure (Residual Invading Phase in dark blue) from the earlier drainage simulation.
As previously for the Drainage simulation also during the Imbibition simulation parts of the displaced fluid (here Oil) get trapped in the structure.
You can repeat the process of loading the final state of the imbibition simulation and setting up a secondary drainage simulation with the same settings as for the first drainage.
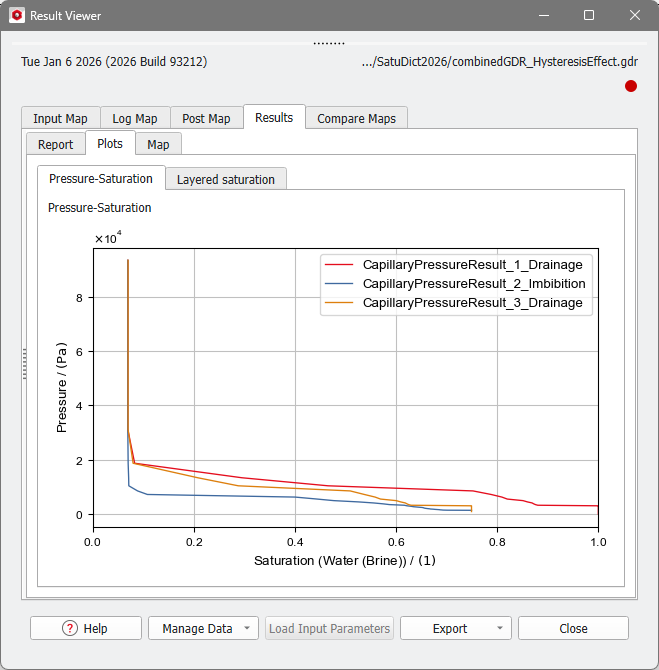
Then, combine the three result files and observe the combined capillary pressure curves, that show a typical hysteresis effect.
As this process of loading files, changing simulation parameters and combining result files requires a lot of manual work and is prone to errors, we developed the Hysteresis for Oil-Water Setups GeoApp (for special setups in the oil&gas industry) and the Hysteresis GeoApp (more general version for other industry areas) to help you setting up the whole simulation easily.