Multi-Phase Segmentation
For more than two materials, the Multi-Phase Segmentation often leads to better results than the Multiple Thresholds method.
If there are bright artifacts at the borders between the different materials or the contrast is low, the Multi-Phase Segmentation can be used to fill these uncertain regions based on the watershed algorithm. Thus, it is very useful to avoid partial volume effects.
The name of the file and folder containing the results can be entered in the Result File Name (*.gdr) box. Choose a name fitting the current project.
Select the Number of Phases between 2 and 255. You can choose the materials for the different phases from the material database.
Define gray value ranges that are assigned to certain phases, by moving the sliders to define the Range for the different phases. The upper limit of each phase range must be smaller than the lower limit of the next phase. If equal, the gray value is assigned to the next phase. For example, if Range 1 is defined as 20-50 and Range 2 is 50-70, the gray value 50 is assigned to Material 2.
All remaining uncertain areas, i.e., the gray values that are not contained in any defined range, are filled using the watershed algorithm.
Click Create Segmentation to apply the multi-phase segmentation to the image dataset.
In the following example the gray values are split in three phases. Material 1 is set to pore space with a definite gray value range of 0-80. The second phase is defined as solid with Range 2 set to 90-100. The main solid material is defined in Material 3 with Range 3 of 130-255. Thus, the gray values 81-89 and 101-129 are not sorted to one of the two phases, as can also be observed in the 2D Slice Visualization section, if Visibility is turned on. The gray values in range 1 are marked in white, the gray values in range 2 in red and the gray values in range 3 in green. All other gray values are not marked. After creating the segmentation these are filled using the watershed algorithm.
Results
After clicking Create Segmentation for one of the segmentation methods, the segmentation is applied for the gray value image. For Global Thresholding, AI Segmentation, Multi-Phase Segmentation, and Hysteresis Thresholding a result file (*.gdr) is generated and saved in the project folder. The generated result file with the name entered for Result File Name is opened automatically in the Result Viewer.
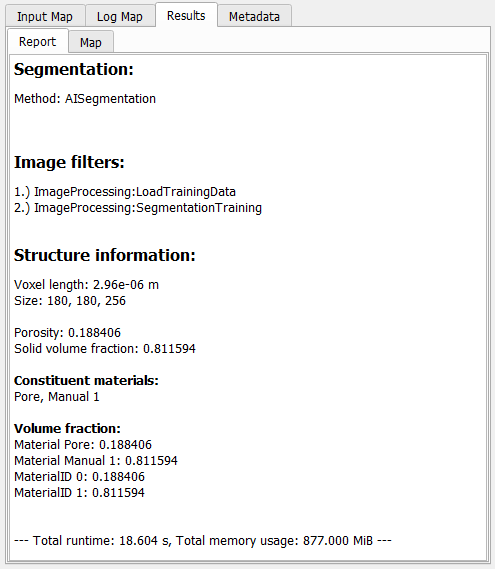
The Report tab lists some basic Structure Information for the resulting structure and all steps done in the Image Processing dialog, e.g., Segmentation methods and the used Image Filters.
In addition to the result file, a result folder with the same name is saved inside the current project folder, containing the segmented structure file (*.gdt) and, for the AI segmentation, also the used labels (*.gld), and the trained model (*.FOREST, *.XGBM, *.UNET2D or *.UNET3D).
For a more detailed description of the Result Viewer options refer to the Result Viewer user guide.