Global Thresholding
There are various options for Image Segmentation via gray value thresholding. Up to 255 thresholds define gray value ranges, at which respective voxels are assigned the according material ID.
Enter the name for the file and folder containing the results in the Result File Name (*.gdr) box. Choose a name fitting the current project.
Two Threshold Modes are available: Single Threshold and Multiple Thresholds. Here, the choice depends on the number of materials in your dataset.
If the segmentation settings are set as desired, click Create Segmentation to import the processed image and generate a 3D structure that is shown in the Visualization area of the GeoDict GUI. This 3D structure can be saved in GeoDict Binary (*.gdt), GeoDict ASCII (*.leS) or 1 Byte integer – Binary (*.raw) format by selecting File → Save Structure as in the menu bar. By default, it is saved as *.gdt in the generated result folder corresponding to the result file with the name chosen for Result File Name.
 Single Threshold
The Single Threshold mode can be applied using a Manual Threshold, Otsu, or KMeans. For more information about the underlying theory refer to the Wikipedia pages Otsu’s method and KMeans clustering.

|
Note! Note that the options Visibility and Outline, which are located in the View Options section control the threshold visualization settings. Please see here for more details. A single threshold can also be visualized in 3D as described here.
|
Use either the Otsu or KMeans method to automatically select a threshold based on the gray value distribution in the histogram or set the threshold manually with the Manual Threshold method.
The value of the single Threshold separates the gray value range into two constituent materials. By default, Material 1 (with ID 00) is Pore and Material 2 (with ID 01) is set to Solid. For each Material, the threshold color and material selection are shown. You can assign each material ID the desired material phase by clicking the available button and following the dialog. Please refer to the Material Database user guide for more details. The threshold color can be changed through Use GeoDict Custom Colors as explained here.
The Volume Fraction states the computed volume fraction corresponding to the current Threshold value, and is automatically updated, whenever threshold values are changed. For example, a calculated Volume Fraction of 0.32 for a Threshold of 127.5 means that 32% of the image voxels have gray values above 127.5 (and are assigned to Material 2).
The Density (kg/m3) of Material 2 and the selected Grammage Plane (X-Y, X-Z, or Y-Z) are used for the calculation of the material’s Grammage. If the density of the Material 2 is known, it can be entered and GeoDict automatically calculates the area density for the selected plane. The density can only be set for Material 2, the density of Material 1 is assumed to be zero. This option is useful for materials like paper, which consist of one solid material and the pore space.
|
Multiple Thresholds
Use Multiple Thresholds when more than one threshold (for more than two different materials) needs to be defined.
The threshold methods are: Manual Threshold, Otsu method, and KMeans-clustering.
The Otsu method is an automatic segmentation algorithm. It can be used for up to 4 thresholds for 8bit images and up to 2 thresholds for 16-bit images. For the Manual or KMeans thresholding, up to 255 thresholds are available. For more information about the underlying theory refer to the Wikipedia pages Otsu’s method and KMeans clustering.
The automatic threshold methods (KMeans and Otsu) use only the histogram to do the segmentation. The Manual thresholds are selected by moving the sliders or entering values.
Enter the Number of Thresholds to be applied. When multiple thresholds are selected, these thresholds are shown in the histogram plot, at the bottom right of the dialog.
For an 8-bit excerpt of a Berea sandstone, four thresholds are set. The according five materials are shown in the histogram plot as determined by the Otsu method.
|
3D Gray Value Visualization in GeoDict
As the gray value image is also visualized in the main GeoDict GUI, the image can also be rendered in 3D.
The currently loaded (and processed) gray value image can be observed in 2D in the Visualization area. To display the image in 3D change to 3D view by clicking the  icon in the toolbar or selecting View → 3D Rendering in the menu bar. icon in the toolbar or selecting View → 3D Rendering in the menu bar.
Visualize different thresholds in 3D using the Threshold By option in the Visualization panel above of the Visualization area in GeoDict.
For the threshold mode ≥ the dark gray values are rendered invisible in the visualization, when moving the threshold slider or entering a gray value number. Here a threshold of 122.5 is entered, which is the Otsu threshold for this image (122.5). For gray value images it is recommended to uncheck Smooth as this feature interpolates values between the voxels to show a smooth surface which can lead to artifacts. Detailed information on visualization in GeoDict can be found in the Visualization user guide.
|
Results
After clicking Create Segmentation for one of the segmentation methods, the segmentation is applied for the gray value image. For Global Thresholding, AI Segmentation, Multi-Phase Segmentation, and Hysteresis Thresholding a result file (*.gdr) is generated and saved in the project folder. The generated result file with the name entered for Result File Name is opened automatically in the Result Viewer.
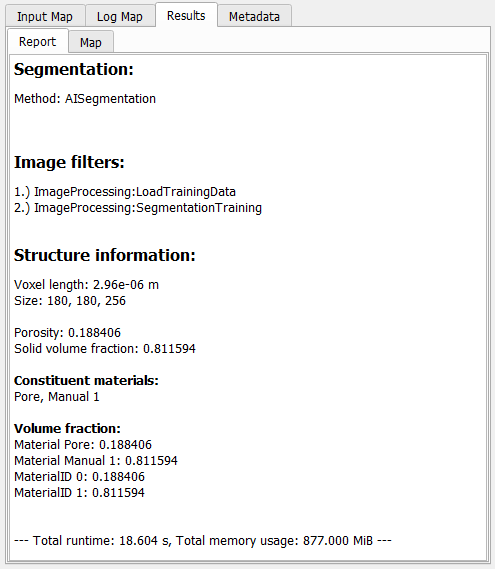
The Report tab lists some basic Structure Information for the resulting structure and all steps done in the Image Processing dialog, e.g., Segmentation methods and the used Image Filters.
In addition to the result file, a result folder with the same name is saved inside the current project folder, containing the segmented structure file (*.gdt) and, for the AI segmentation, also the used labels (*.gld), and the trained model (*.FOREST, *.XGBM, *.UNET2D or *.UNET3D).
For a more detailed description of the Result Viewer options refer to the Result Viewer user guide.
|